
 By
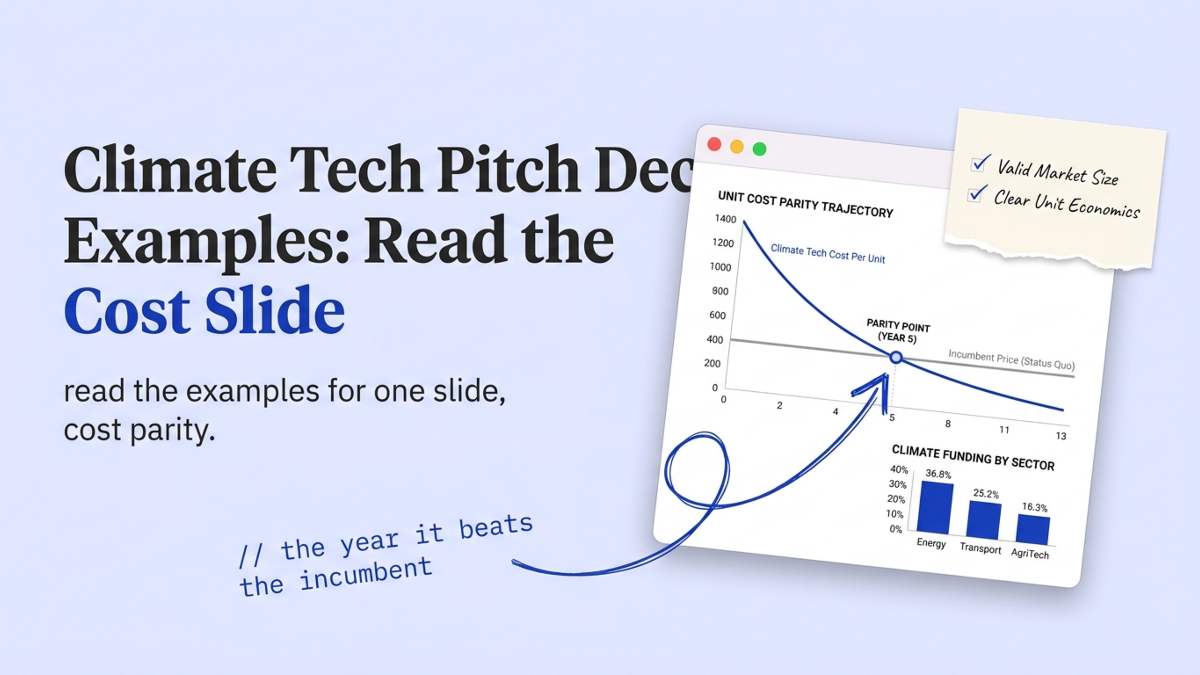
Climate tech pitch deck examples are easy to collect and hard to learn from. The galleries ranking for this search hand you Woodoo and Sylvera with no note on which slide actually raised the money. We review founder decks every day at StartWise, and a climate deck breaks from every other deck on one slide: the unit-economics slide, which has to prove your cost reaches parity with the incumbent before anyone funds the impact. Energy alone took 36 percent of 2025’s $40.5 billion in climate funding (Sightline Climate, 2026). Here’s how to read the examples for that.
What makes a climate tech pitch deck different?
A climate tech deck lives or dies on whether the technology gets cheap enough to win without a subsidy. They’ve watched a decade of decks sell gigatons of avoided carbon, so investors skim the impact math and hunt for the cost curve. The slide that carries the story is the unit economics, where a SaaS deck leans on retention and a marketplace deck leans on liquidity.
The first thing I flag on a climate deck is a hero number for tonnes of CO2 avoided, with no line on what the product costs today. Big planetary promise, no price tag.
So the slides that decide a climate meeting are the unit-economics slide, the market slide, and the go-to-market, in that order of scrutiny. Nail the first and you’ll get a fairer read on the rest.
Five climate tech decks worth studying slide by slide
The climate tech pitch deck examples worth your hour are the ones where you can reverse-engineer the cost-and-scale story, not the ones with the cleanest render. Pitch hosts a gallery of real climate decks, and the raise behind each one tells you what landed. Here’s what we’d pull from them.
- Woodoo raised $31 million on an 8-slide deck led by Lowercarbon Capital (Pitch), selling a structural wood that competes with plastic and metal on cost, not on carbon alone.
- Sylvera closed a $32 million Series A by packaging problem, methodology, and product into a tight deck for carbon-data buyers who need the numbers to be trusted.
- Pledge raised $4.5 million in seed to embed emissions measurement into business workflows, a software wedge in a hardware-heavy field.
- Space Forge pulled a $10.2 million seed, four times its original target, by pairing an in-space manufacturing story with a route to a priced product.
- Sensorfact raised a 25 million euro Series B on energy savings the factory reads on its own bill, the clearest cost argument in the set.
Study four of these properly. Skimming forty galleries teaches you layout, not fundraising.
How should the unit-economics slide show cost parity?
Show the cost curve crossing the incumbent’s price, and mark the year it happens. The strongest climate decks we review put one bottom-up unit on the slide, cost per tonne, per kWh, or per module, and chart it falling to parity without leaning on a grant or a carbon credit to get there.
StartWise's position
Most climate impact slides are theater. After reviewing decks daily, our take is that a gigaton TAM tells an investor nothing: a unit cost that beats the incumbent without the subsidy tells them everything. Put the price before the planet.
The galleries never show you this, because a static deck image can’t hold a falling cost curve or the assumptions under it. So founders copy the big impact headline and they’ll skip the slide that moves the money. The impact is why you started. The cost curve is why you get funded.
An investor has seen a hundred gigaton charts. The founder who shows the year their cost beats the incumbent is the one who gets the second meeting.
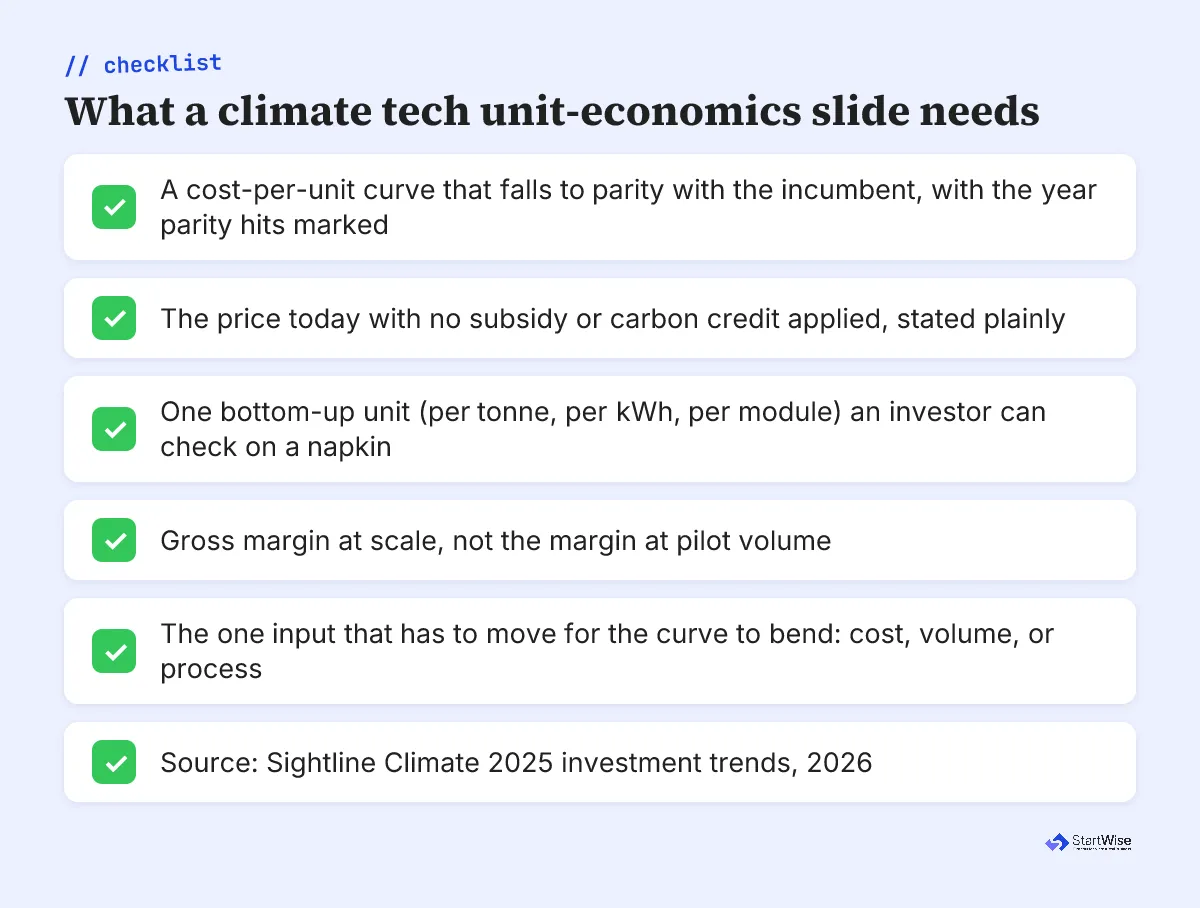
Your climate unit-economics slide needs five things, and the checklist below is the version we hand founders before a review:
- One bottom-up unit, cost per tonne, kWh, or module, that an investor can sanity-check on a napkin.
- A curve showing that unit cost falling to parity, with the parity year marked.
- Today’s price with no subsidy or carbon credit applied.
- Gross margin at scale, not the margin at pilot volume.
- The single input that has to move for the curve to bend.
What climate funding numbers should shape your deck?
Climate funding in 2026 is bigger but narrower, and your deck has to read the room. Investment runs near $50 billion on an annualized basis, up from a 2024 trough, but the money is concentrating: deal counts fell 18 percent in 2025 while growth-stage dollars rose 78 percent (Sightline Climate, 2026; Value Add VC, 2026).
| Climate sector | Share of 2026 funding | What it means for your deck |
|---|---|---|
| Energy and grid | 35%+ | Priced offtake and a clear cost advantage win fast |
| Transportation and mobility | 20% | Show total cost of ownership versus the incumbent |
| Industrial decarbonization | 12% | Name the customer’s payback period in months |
| Carbon removal and capture | 10% | Cost per tonne and who buys it at that price |
| Climate software and fintech | 6% | Distribution and margin carry the deck, not hardware |
Source: Value Add VC, 2026.
18%
Climate deal counts fell this much in 2025 even as total dollars rose, because capital is pooling into fewer, later, more proven companies. A pre-seed climate deck now clears a higher evidence bar. Sightline Climate, 2026
Here’s what that means for you. If you’ve picked a software or fintech angle on climate, you’re fishing in roughly 6 percent of the pool, so you’ll have to argue cost and distribution harder than an energy-hardware founder does. I’d rather see a sharp wedge into one buyer than a slide claiming the whole $50 billion is yours to win.
Not sure your unit-economics slide would survive an investor's cost question?
How do you handle policy and subsidy dependency?
Name your subsidy exposure before an investor asks, because every climate investor has been burned by a model that won’t work without a tax credit intact. The decks we flag lean on the current incentive as if it’s permanent. The ones that raise show the unit economics marching to parity on their own, then treat policy as upside.
This is the climate version of a risk slide. Put one line on what happens to your margin if the subsidy halves, and one on the path to standing without it. A founder who’s honest that they need three more years of the credit, and shows the cost curve that retires the need, reads as someone who’s done the math.
Policy is a tailwind you don’t control. Your cost curve is the one you do.
What changes from pre-seed to seed climate decks?
Between pre-seed and seed, the climate bar moves from “could this get cheap” to “is it getting cheaper on schedule.” At pre-seed, investors fund a credible cost curve and a team that can bend it, sometimes before a product exists. You’ll raise on a convincing techno-economic model and a pilot letter of intent.
By seed, they’ll want proof the curve is bending: a pilot at real cost, a first commercial contract, a unit cost that’s dropped since the last round. Investors spend about 3.2 minutes on a deck (Papermark, 2024-2025), so parity and progress have to read in seconds. The jump mirrors what we cover in the pre-seed and seed round deck breakdowns.
What to do this week
Rebuild your climate deck around the unit-economics slide, then work outward. Here’s the order I’d fix it in to get the most from an hour:
- Put one bottom-up unit on the slide, cost per tonne, kWh, or module, and chart it falling to parity.
- Mark the year your cost crosses the incumbent’s price, and state today’s price with no subsidy applied.
- Add a margin-at-scale line and the one input that has to move for the curve to bend.
- Write your policy exposure as one risk line plus the path to standing without the credit.
- Read four real climate decks from the Pitch gallery for the cost-and-scale story, then cut any slide of yours that doesn’t move it.
A gigaton of avoided carbon doesn’t pencil. A unit that beats the incumbent does, and that’s the number that earns the next round. Put the price before the planet, and the rest of the deck gets a fairer read.