
 By
By 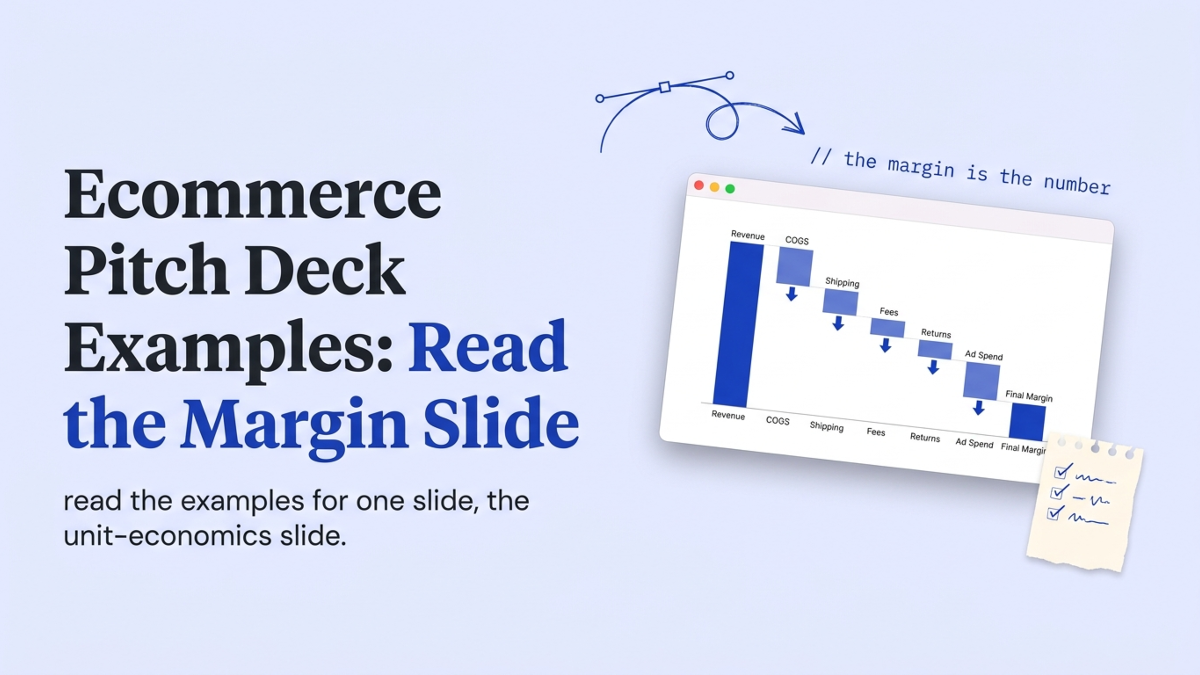
Ecommerce pitch deck examples are easy to find and hard to learn from. The galleries that rank for this search hand you finished decks from brands that already raised millions, with no note on which slide won the money. At StartWise we review founder decks every day, and an ecommerce deck differs from every other deck on one slide: unit economics. The design is a distraction. Here’s what belongs on that slide, the 2026 benchmarks for each number, and how to read the famous decks for it instead of their look.
What makes an ecommerce pitch deck different from any other deck?
An ecommerce pitch deck differs from a generic deck on one slide: unit economics. The cover, problem, solution, market, team, and ask sections are the same slides every founder builds, in roughly the same order. What changes is that an investor reading a physical-product business wants to see whether you keep money after you ship the box.
We see the same miss every week. A founder copies a famous deck’s flow, nails the design, then puts a giant revenue or GMV number on the one slide meant to carry the business. GMV, short for gross merchandise value, is the total sales run through the store before any cost comes out. It flatters the founder and tells the investor almost nothing.
The shared slides still matter, and we’ve written about what each pitch deck slide actually does. But on those slides an ecommerce deck and a software deck look nearly identical. Unit economics is where the category shows, because a template can’t know that an ecommerce investor is hunting for contribution margin, not a download count.
Which numbers belong on the unit-economics slide?
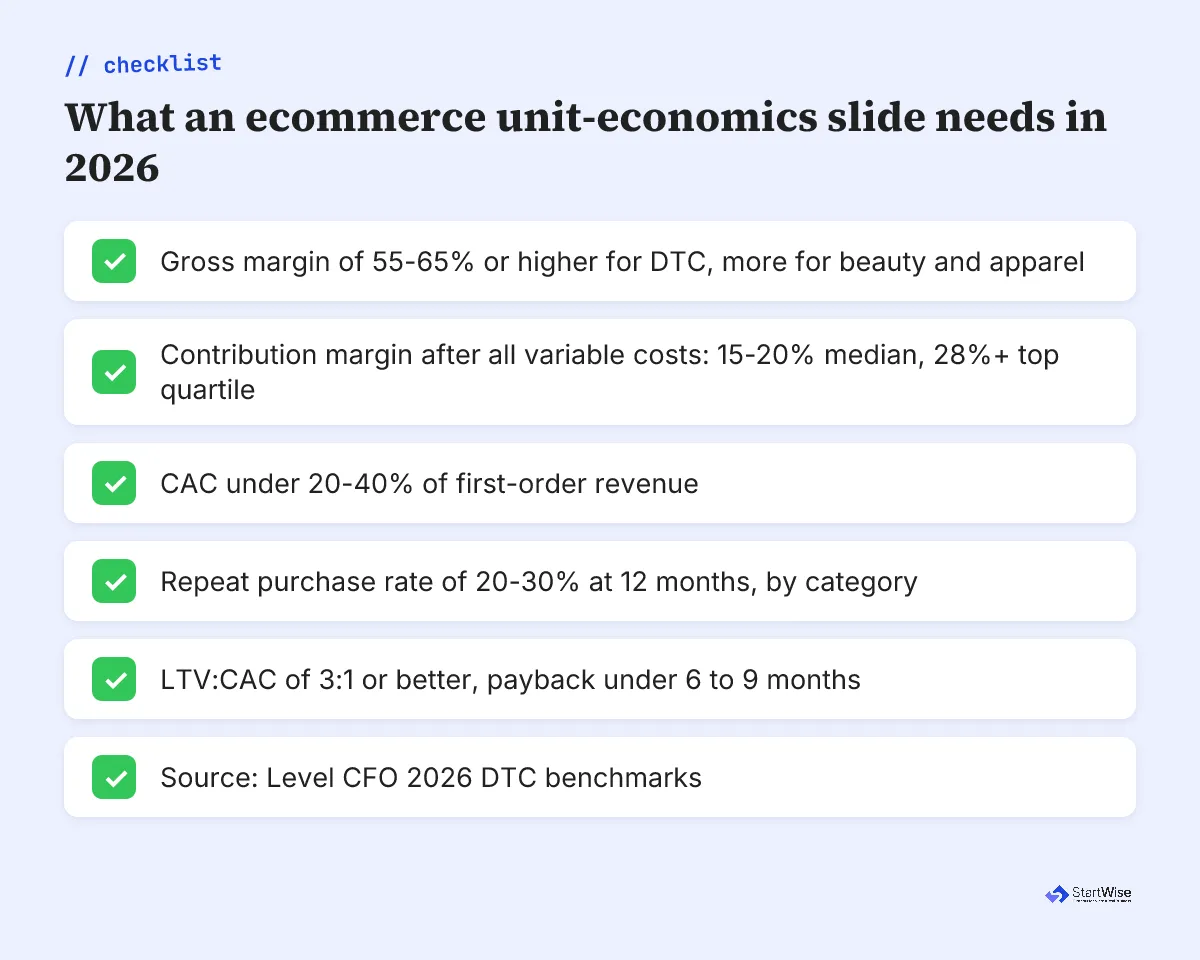
Seven numbers belong on an ecommerce unit-economics slide, and each answers a question an investor would otherwise ask out loud: how much you keep per sale, whether acquisition pays back, and whether customers come back.
| Metric | What it shows | The 2026 bar investors want |
|---|---|---|
| Gross margin | Money left after COGS | 55-65%+ for DTC, higher in beauty |
| Contribution margin | What’s left after every variable cost | 15-20% median, 28%+ top quartile |
| CAC | Cost to win one customer | Under 20-40% of first-order revenue |
| Repeat purchase rate | Whether customers come back | 20-30% at 12 months, by category |
| LTV:CAC | Whether the model compounds | 3:1 or better |
| CAC payback | How fast acquisition pays back | Under 6 to 9 months |
Most of those bars come from Level CFO’s 2026 DTC benchmarks. Contribution margin is the headline. It’s what’s left of a sale after COGS, shipping, payment fees, returns, and the paid acquisition it took to make the sale. Level CFO puts the median DTC contribution margin at 15-20%, with top-quartile brands above 28%.
Gross margin is the trap we flag most on ecommerce decks, because it looks great on its own. A Shopify apparel brand can post a 65-70% gross margin and still bleed cash once you subtract the 8-12% that shipping eats, the roughly 2.9% for payment processing, returns, and ad spend. An Amazon FBA business can show a similar top line and net 5-10% after fees, per Level CFO. Same category, wildly different businesses. The margin slide is where that gap shows up.
Why contribution margin beats gross margin on the slide
Contribution margin beats gross margin on the slide because it’s the number that survives the real world. Gross margin only subtracts the cost of goods. Contribution margin subtracts everything it takes to actually get one order into one customer’s hands, then keeps going until the last variable cost is gone.
Revenue is what an ecommerce brand sells. Contribution margin is what it keeps. Investors fund the second number.
In review, we go straight to this math. Here’s the test an investor runs on your slide too. They take your average order value, subtract each variable cost line, and see what’s left. Level CFO’s benchmarks put a reference AOV around $55 to $85, with CAC eating 20-40% of that first order. If your CAC is 35% of a $60 order and your product costs 40% to make, the first sale barely breaks even. That’s normal in DTC. It only works if the customer comes back.
That’s why repeat purchase rate sits right next to margin on a good slide. Level CFO reports a 20-30% repeat rate at 12 months across DTC, rising to 30-35% for food and beverage brands and sitting at 15-20% for home goods. A brand that buys a customer once and never sees them again is a brand that has to keep buying growth. Investors know that math cold, and Qubit Capital says an LTV:CAC ratio under 3 usually triggers pushback on your unit economics.
StartWise's position
On an ecommerce deck, traction is a slope before it's a number. Founders fill the slide with a cumulative revenue or GMV total when an investor at this stage reads the rate of change and the margin trend instead. A contribution margin climbing each quarter with a repeat-cohort curve behind it carries more weight than a big static sales figure. With about 3.2 minutes of attention on the whole deck (Papermark, 2024), a number that doesn't move is a number that hasn't earned its slot.
Not sure your unit-economics slide survives an investor's math? Get a free, slide-by-slide review of your deck with a concrete fix list, in minutes.
What do the famous ecommerce deck examples actually show?
The famous ecommerce deck examples show a mixed lesson, which is exactly why you read them for the slide and not the whole thing. Alexander Jarvis hosts 21 real ecommerce decks, from Babylist’s $650k seed to Public Goods’ $6M seed. Beautiful decks, most of them. Almost none put a clean contribution-margin waterfall on the table, because many raised in an era when growth alone got funded.
That era is over. Qubit Capital’s read of the market is blunt: investors now assume the model is flawed if the unit-economics logic breaks under basic questions. So the examples teach you structure and story order, and you supply the numbers today’s investor demands.
That’s how I read an example in a review: go to the money slides first and ask what actually earned the round. On an ecommerce deck, that means the margin math, not the lifestyle photography.
Read SaaS pitch deck examples for the metrics slide and marketplace pitch deck examples for the liquidity slide the same way, and you’ll notice the discipline travels across industries even when the specific numbers never do.
What goes on the slide before you have strong margins?
Before you have strong margins, the unit-economics slide shows a direction and a plausible path, not a polished table. Most pre-seed ecommerce founders are still buying every customer at a loss, and pretending otherwise reads worse than owning it. So you show the early curve and the lever that bends it.
We tell founders to plot the cohort, not the total. A first order that loses money is fine if the second and third orders climb, so show the repeat curve from your real cohorts and name the mechanism, a subscription, a refill, a bundle, that pulls customers back. A margin that improves as you buy better and ship smarter is a story an investor can back.
Stack the signals you have instead of inventing the one you don’t. A rising repeat rate on your last three monthly cohorts, a gross margin that widened as you renegotiated COGS, and a CAC trending down as one channel matures add up to a credible slide, even before contribution margin turns positive. Pair it with the traction slope investors actually read, and you have the pre-revenue version of the money slide.
Where to find real ecommerce pitch deck examples
Real ecommerce pitch deck examples live in a few public galleries, but read every one for the unit-economics slide, not the format. Alexander Jarvis and AngelMatch host dozens of full decks end to end. BaseTemplates walks through a standard slide order, though like most guides it stops short of the benchmarks that decide the round.
The example we point founders to is never a static gallery on its own. A finished deck with no notes tells you what a brand chose, not why it worked or where it would get flagged. So read with three questions in hand:
- Open the money slides first. Find the margin math before you admire the product shots.
- Note which costs they subtract, and which they quietly leave out of the margin.
- Check the year. A deck that raised in 2021 was selling growth to a market that no longer exists.
For the cross-industry classics, what to copy and skip in pitch deck examples reads them with the same eye, and the financials slide guide covers what stays on the slide versus what belongs in your model. If your market slide leans on a $1T retail number, size it bottom-up instead.
What to do this week
This week, rebuild your unit-economics slide before you touch the design on any other slide. It’s the slide we fix first in almost every ecommerce review, because it’s the one that separates a deck that looks funded from one that gets funded.
- Build the contribution-margin waterfall: start at AOV, subtract COGS, shipping, fees, returns, and CAC, and show what’s left.
- Put your repeat purchase rate right next to it. A single-purchase brand needs a bigger margin to survive.
- Show LTV:CAC and payback period, not a GMV total. Under 3:1 invites the hard questions.
- If you’re pre-revenue, plot the cohort curve and name the lever that bends it, instead of faking a margin you don’t have yet.
- Open three example decks, jump to their money slides, and copy the structure, never the numbers.
Then put it in front of someone who reads ecommerce decks the way investors do, before an investor does. On a physical-product deck, the gap between polished and fundable is almost always this one slide.