
 By
By 
Marketplace pitch deck examples are everywhere and hard to learn from. The galleries that rank for this search hand you finished decks from Airbnb and Uber with no note on which slide actually raised the money. We review founder decks every day at StartWise, and a marketplace deck breaks from every other deck on one slide: the traction slide, which has to prove liquidity before it proves size. Consumer marketplaces keep just 10 to 15 percent of GMV as revenue (CRV, 2026), so the raw GMV total misleads more than it sells. Here’s how to read the examples for that.
What makes a marketplace pitch deck different?
A marketplace pitch deck sells two customers at once. The supply side and the demand side each have their own problem, their own motivation, and their own reason to leave, and your deck has to prove they meet in the middle and transact. Most founders we review write a single story and force both audiences into it. That’s the first thing we flag on a marketplace deck.
The hero metric is liquidity, not headcount or downloads. Liquidity is the share of listings or visitors that actually turn into a transaction, and it’s the earliest signal your marketplace works without you pushing every deal by hand. A healthy buyer liquidity rate sits between 30 and 60 percent (Phoenix Strategy Group, 2025). Below that, you don’t have a marketplace yet. You have two email lists.
So the slides that carry a marketplace deck are the traction slide, the business model slide, and the go-to-market slide, in that order of scrutiny. The rest matter. These three decide the meeting.
Six marketplace decks worth studying slide by slide
The best marketplace pitch deck examples are the ones where you can reverse-engineer the liquidity story instead of admiring the layout. Failory hosts 62 real marketplace decks spanning 2004 to 2022, from Airbnb and Uber to Kyra and Pearpop. Read them for how each one framed supply and demand, and always check the year, because a deck that raised in 2021 was pitching a far friendlier market than today’s. You’ll spot the pattern fast once you know it’s liquidity you’re hunting.
Here’s what we tell founders to pull from the famous ones:
- Airbnb’s seed deck: the cleanest two-sided problem framing, a single line each for hosts and guests, so an investor grasps both sides in one read.
- Uber’s early deck: demand-side convenience paired with a supply story about drivers’ idle time, the template for on-demand liquidity.
- Etsy and eBay: proof that a modest take rate scales. Etsy keeps about 6.5 percent of GMV and eBay about 9 percent (Phoenix Strategy Group, 2025), and both built enormous businesses on single-digit rates.
- Uber and Fiverr: the other end of the range, at 25 to 30 percent and 25.5 percent respectively, which only holds when the platform does real work in the transaction.
Study four decks properly. Skimming forty teaches you nothing.
How should the traction slide show marketplace liquidity?
Show liquidity in one real market before you show size across all of them. The strongest marketplace traction slides we review pick a single city, category, or cohort where supply and demand have started to clear on their own, then prove the slope: transactions week over week, match rate climbing, sellers coming back. A blended GMV total spread across ten cities buries the exact thing investors want to see.
StartWise's position
Traction on a marketplace deck is a slope, not a total. After reviewing decks daily, our take is that one market compounding week over week beats a national GMV number every time. Prove liquidity in one place, then argue you can repeat it.
One YC-backed marketplace approached its Series A with just $50,000 in monthly GMV and 35 percent sequential growth (CRV, 2026). The absolute number is tiny. The slope is what earned the meeting. That’s the pattern we push every marketplace founder toward: prove the curve in one place, then make the case you can copy it.
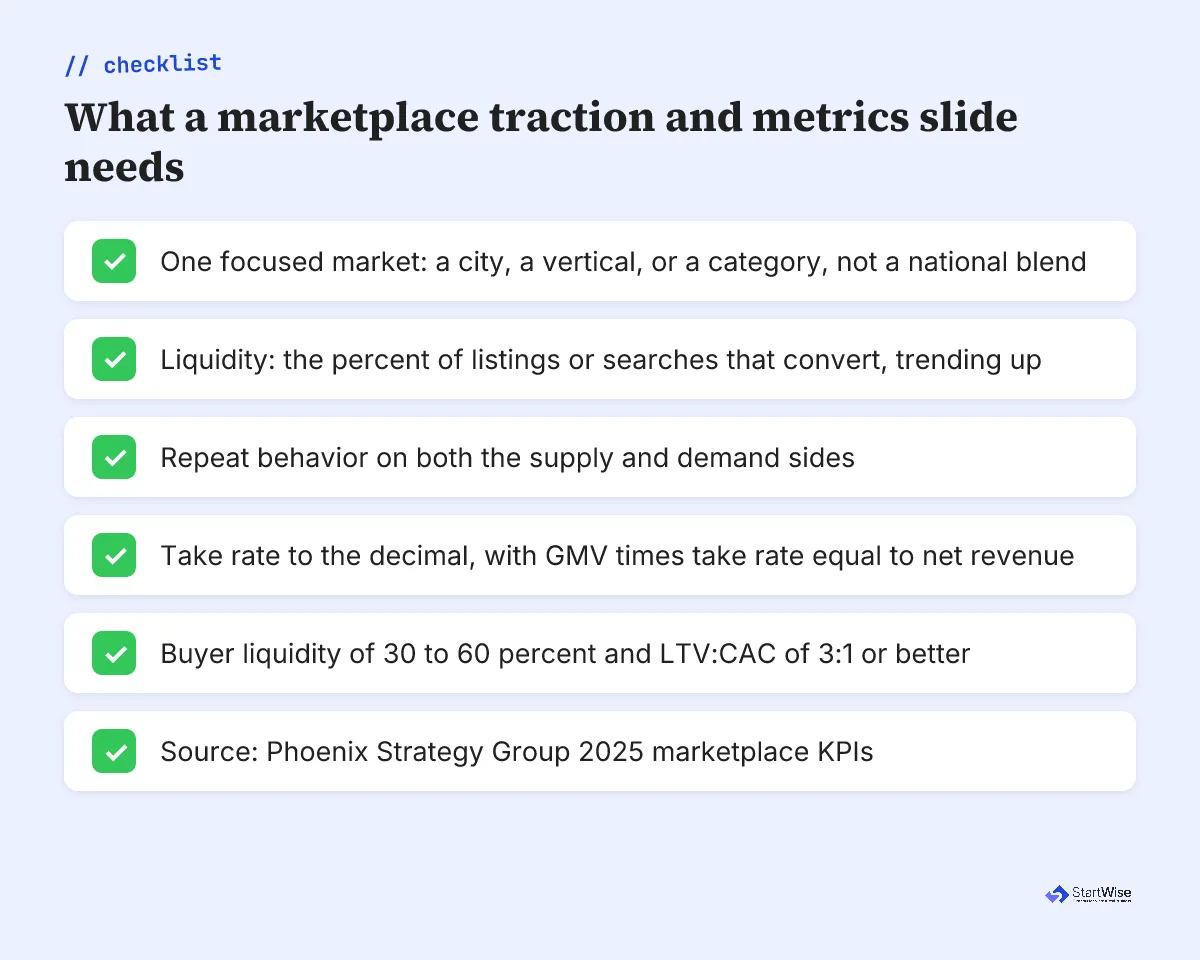
Your marketplace traction slide needs four things:
- One focused market, a city, a vertical, or a category, not a national blend.
- Liquidity itself: the percent of listings or searches that convert, trending up.
- Repeat behavior on both sides, because a marketplace that leaks supply every month isn’t compounding.
- A believable mechanism for why the curve keeps going, tied to your go-to-market.
Why do investors probe your take rate first?
Investors probe take rate before GMV because take rate tells them how much of that GMV you keep. GMV is the total value of everything sold through your platform. Take rate is the slice you keep as revenue (Stripe, 2023). Show one without the other and you’ll stall diligence, because the gap between them can be enormous. Klarna reported $19.65 billion in GMV against $457 million in revenue, roughly a 43x gap (CRV, 2026).
GMV is the number founders put in the headline. Take rate is the number investors use to decide whether the headline is real.
That gap is why presenting GMV and revenue interchangeably reads as a misstatement of your real size (CRV, 2026). Know your take rate to the decimal, put it on the slide, and make sure GMV multiplied by take rate equals the net revenue you show everywhere else. Take rates vary widely by model, and in the decks we review real rates often land below the range investors quote. Here’s the spread they carry in their heads:
| Marketplace model | Take rate investors expect | Real-world examples |
|---|---|---|
| Consumer marketplace | 10 to 15 percent (CRV, 2026) | Etsy 6.5%, eBay 9% |
| B2B marketplace | 5 to 10 percent (CRV, 2026) | lower-touch, higher volume |
| On-demand and gig | up to 25 to 30 percent | Uber 25-30%, Fiverr 25.5% |
| Stays and travel | 3 to 20 percent | Airbnb 3-20% |
43x
The gap between Klarna's reported GMV and its revenue. Showing GMV without take rate lets an investor imagine a company far bigger than the one you're building. CRV, 2026
Notice the on-demand platforms sit highest. A 25 to 30 percent take rate holds only when the platform does real work in the transaction: matching, payments, trust, and dispute handling. If you’re charging Uber’s rate for eBay’s service, that’s a question you’ll get asked in the first meeting.
Not sure your metrics slide would survive an investor's take-rate question?
Solving the chicken-and-egg problem on one slide
The chicken-and-egg problem is the marketplace founder’s oldest question: buyers won’t come without sellers, and sellers won’t come without buyers. Investors know it cold, and they’re rarely fooled by a slide that hand-waves it, so the slide that addresses it has to name your constrained side and show how you seeded it. The strongest versions we see pick the side that’s harder to get, usually supply, and prove they can build it in one market before spending a dollar on the other.
The decks that clear this bar do one thing. They show a wedge: a single category, a single city, a single use case where you manufactured enough supply to make demand worth serving. Then they show the flywheel starting. That reads far better than a slide claiming you’ll grow both sides at once with paid ads.
Every marketplace that worked started lopsided: one side manufactured by hand until the other side had a reason to show up.
What changes from pre-seed to seed marketplace decks?
Between pre-seed and seed, the bar moves from “can this clear at all” to “does this repeat.” At pre-seed, investors fund proof that one market reached liquidity and that you understand why. You can raise on a single city with a believable slope and a sharp constrained-side story.
By seed, they want the playbook. We expect to see the first market’s cohorts holding, a second market opening on the same motion, and retention that doesn’t collapse. That last part matters because supply is leaky: marketplaces keep 80 to 95 percent of supply-side GMV in the first three months but only 45 to 50 percent by month 12 (Phoenix Strategy Group, 2025). A seed deck has to show that curve flattening, or investors assume every new market resets to zero. The jump mirrors what we cover in the pre-seed and seed round deck breakdowns.
What to do this week
Rebuild your marketplace deck around the traction slide, then work outward. Here’s the order we’d fix it in to get the most out of an hour:
- Pick your one market. Cut the blended national GMV and replace it with the single city, category, or cohort where liquidity is highest.
- Put your take rate on the business model slide, to the decimal, and check that GMV times take rate equals your net revenue everywhere else.
- Name your constrained side and show the wedge you used to seed it.
- Add the cohort curve for supply retention, even if it’s early and imperfect.
- Read four real marketplace decks from Failory’s gallery for the liquidity story, then cut any slide of yours that doesn’t move it.
Two email lists don’t compound. A single market that has learned to clear on its own does, and that’s what lets you argue you can do it again. Once you’ve nailed those three slides, the rest of the deck almost writes itself.