
 By
Consumer app pitch deck examples are easy to find and hard to learn from. The galleries ranking for this search hand you Airbnb and Snapchat with no note on which slide raised the money. We review founder decks every day at StartWise, and a consumer app deck breaks from every other deck on one slide: the traction slide, which has to prove retention before it proves size. The median mobile app keeps just 4 percent of its users by day 30 (UXCam, 2026), so a download count sells nothing. Here’s how to read the examples for that.
What makes a consumer app pitch deck different?
A consumer app deck lives or dies on whether strangers come back without being paid to. Downloads are cheap and investors know it, so the deck has to answer one question fast: do users stick? Retention and engagement become the spine of the story, where a SaaS deck leans on contracts and a marketplace deck leans on liquidity.
That changes which slides carry the weight. The first thing I flag on a consumer deck is a traction slide stacked with install counts and app-store ratings, nothing about whether week-two looks like week-one. Big top-line number, no curve underneath it.
So the slides that decide a consumer app meeting are the traction slide, the business model slide, and the product slide, in that order of scrutiny. The rest matter. These three earn the call.
Five consumer app decks worth studying slide by slide
The best consumer app pitch deck examples are the ones where you can reverse-engineer the retention story instead of admiring the layout. Visible hosts a gallery of real decks from Airbnb, Snapchat, Tinder, Mint, and Buffer, and Failory curates consumer startups down to tiny raises like KiKi, a social app that pulled in 100,000 dollars on its deck. Read them for how each framed the “will they come back” question, and always check the year, because a 2014 deck pitched a far cheaper user than today’s.
Here’s what we tell founders to pull from the famous ones:
- Airbnb’s seed deck: a clean problem and a single demonstrated behavior, so an investor grasps both the pain and the use in one read.
- Snapchat’s early deck: screenshots doing the talking, showing exactly how the product felt in the hand rather than describing it.
- Mint’s deck: a sharp “superior alternative” frame that won its first round by positioning against clunky incumbents, not by listing features.
- Buffer’s seed deck: raised 500,000 dollars (Visible) with traction on the second slide, the move that set the template every PLG founder now copies.
- Foursquare’s 2009 deck: iPhone graphics showing the points and badges, so investors saw the engagement loop instead of reading about it.
Study four decks properly. Skimming forty teaches you nothing.
How should the traction slide show retention?
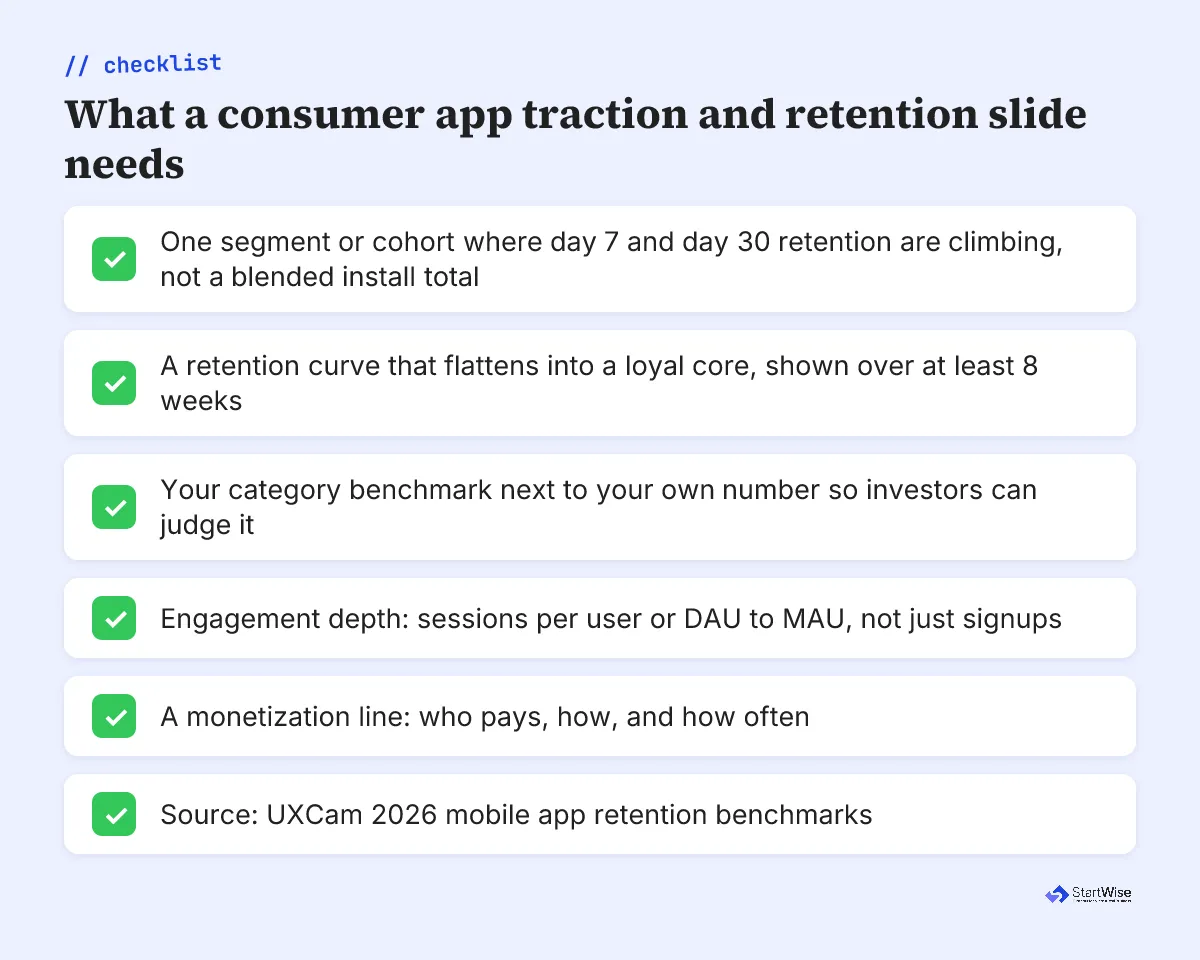
Show retention climbing in one segment before you show reach across all of them. The strongest consumer traction slides we review pick a single cohort, a channel, a city, or a launch week, and prove the curve: day 7 holding, day 30 flattening into a loyal core, sessions per user ticking up. A blended install total spread across every channel buries the one thing investors came to see.
StartWise's position
Traction on a consumer app deck is a slope, not a number. After reviewing decks daily, our take is that a retention curve flattening in one segment beats a million downloads every time. Prove the curve in one place, then argue you can widen it.
The galleries never show you this, because a static slide image can’t hold a cohort curve. So founders copy the download headline and skip the thing that actually earned the money. A download is a promise. Retention is the only slide that shows the promise was kept.
Investors have seen a thousand hockey-stick install charts. The founder who shows week-four looking like week-one is the one who gets the second meeting.
Your consumer app traction slide needs four things, and the checklist below is the version we hand founders before a review:
- One cohort where day 7 and day 30 retention are climbing, not a blended install total.
- The curve itself, shown over at least eight weeks so the flattening is visible.
- Engagement depth: sessions per user, or the DAU to MAU ratio.
- A believable reason the curve widens, tied to your channel strategy.
What retention numbers do investors expect?
Investors read your retention number against a category benchmark, so the same 8 percent can look strong or weak depending on what you build. The all-app median day 30 retention sits near 4 percent (UXCam, 2026), compiled from AppsFlyer and Adjust data across more than 37,000 apps. That median is the backdrop every consumer number gets judged against.
4%
The median mobile app keeps only this share of its users by day 30. A raw download total on your traction slide hides it, which is exactly why investors ask for the curve. UXCam, 2026
Here’s what strong performers hold at each checkpoint, so you can place your own number before an investor does it for you:
| App category | Day 1 retention | Day 7 retention | Day 30 retention |
|---|---|---|---|
| Social and communication | 50 to 60% | 25 to 30% | 15 to 20% |
| Fintech and banking | 35 to 45% | 18 to 25% | 10 to 15% |
| Health and fitness | 35 to 45% | 15 to 22% | 8 to 12% |
| Gaming | 40 to 50% | 12 to 18% | 5 to 8% |
| Ecommerce and retail | 25 to 30% | 8 to 12% | 3 to 6% |
Source: UXCam, 2026 (strong-performer benchmarks). Notice social sits highest and ecommerce lowest, which is why a shopping app at 5 percent day 30 can be healthy while a social app at 5 percent is in trouble. Label your category on the slide. An investor who has to guess it will guess against you.
Not sure your traction slide would survive an investor's retention question?
How do you show monetization when the app is free?
Name the money model plainly, because a free app makes investors wonder whether this is a business or a hobby. Most consumer apps launch free, so the business model slide is where you say who pays, when they pay, and how much, whether that’s freemium, a subscription, ads, or in-app purchases. The decks we flag most hide this behind a line about monetizing later.
Pick one primary model and defend it. A fitness app that converts 5 percent of free users to a subscription is a different company from one selling ads against daily sessions, and investors price those futures differently. If you genuinely have two revenue lines, show which one you’re betting on first.
One quiet tell from the galleries: Visible notes that only 5 of 96 accelerator pitch decks it reviewed included a clear funding ask. Consumer founders, deep in product love, forget to tie retention and monetization to the money they want. Don’t be the deck that proves the loop works and then never asks.
What changes from pre-seed to seed consumer decks?
Between pre-seed and seed, the bar moves from “do a few people love this” to “does that love scale.” At pre-seed, investors fund a sharp retention curve in one cohort plus a believable reason it widens. You can raise on a few thousand engaged users if the day 30 number beats your category median and the story for growth is honest.
By seed, they want the playbook. We expect cohorts holding across several months, a second channel starting to retain on the same motion, and a monetization signal that’s real rather than projected. Investors spend about 3.2 minutes on a deck (Papermark, 2024-2025), so the retention curve and the money model have to read in seconds at either stage. The jump mirrors what we cover in the pre-seed and seed round deck breakdowns, and it’s the same jump an ecommerce deck makes on its own metrics.
What to do this week
Rebuild your consumer deck around the traction slide, then work outward. Here’s the order we’d fix it in to get the most from an hour:
- Pick your one cohort. Cut the blended install total and replace it with the single channel or launch week where retention is strongest.
- Draw the curve over at least eight weeks, and put your category benchmark right next to it.
- Add one engagement number, sessions per user or DAU to MAU, so the curve has a reason behind it.
- Name your monetization model on the business model slide: who pays, how, how often.
- Read four real consumer decks from the Visible or Failory galleries for the retention story, then cut any slide of yours that doesn’t move it.
A million downloads don’t compound. A cohort that keeps coming back does, and that’s what lets you argue you can win the next one. Nail those slides, and the rest of the deck almost writes itself.