
 By
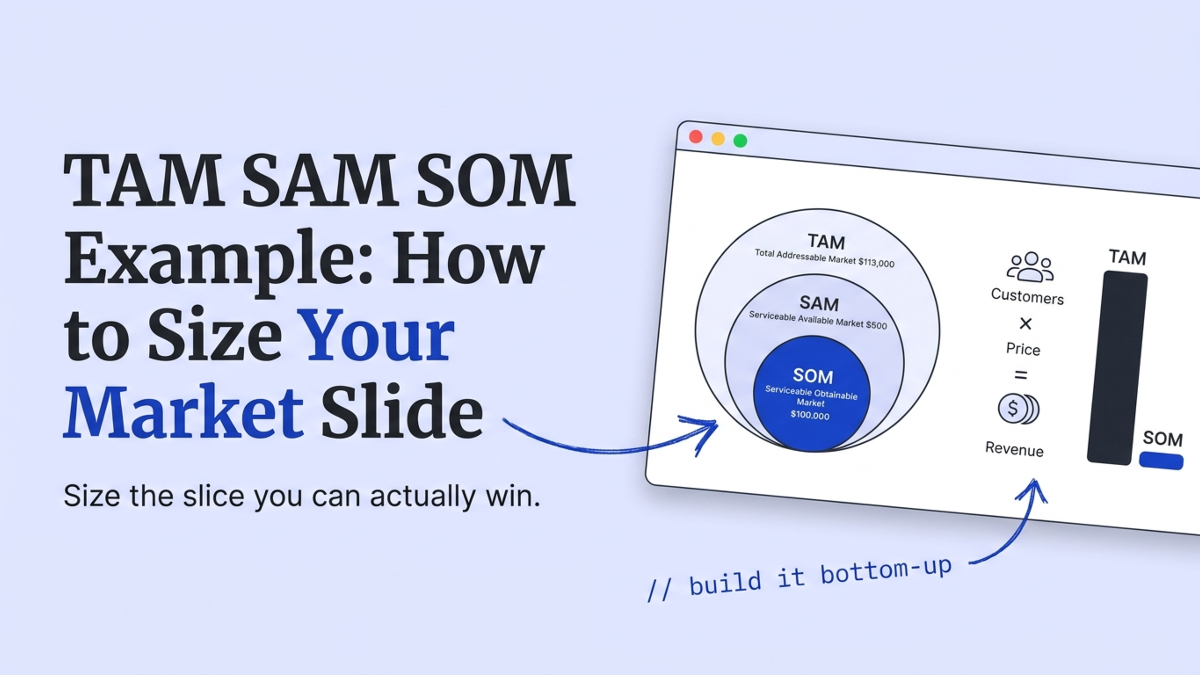
TAM, SAM, and SOM are the three numbers on your market slide: the whole market, the slice you can serve, and the piece you can win first. A TAM SAM SOM example is only useful if it shows the math, not the definitions. Most pages ranking for this search hand you a hospital or enterprise CRM example with numbers no pre-seed founder will type. We review founder decks at StartWise every day, and the market slide gets flagged more than almost any slide. Here’s a worked example you can copy, and what a reviewer looks for behind it.
What is a TAM SAM SOM example, and what are the three numbers?
TAM, SAM, and SOM split your market into three shrinking layers, from everyone who could ever buy down to the customers you can realistically win first. Get the definitions straight before you touch a spreadsheet, because most decks confuse the middle two.
TAM, the total addressable market, is the revenue you would earn with 100% of the market and no competition. It’s the ceiling, and it’s almost never the point.
SAM, the serviceable addressable market, is the slice of that TAM your product, pricing, and geography can actually reach. If you sell English-only software to US clinics, non-US and non-English buyers fall out of your SAM.
SOM, the serviceable obtainable market, is the share of SAM you can win in about three years, given your team, your channel, and the competitors already there. This is the number investors read first, and the one most founders fudge.
Here’s the trap we see weekly. A founder nails the TAM, hand-waves the SAM, then sets SOM at “1% of the market” with no math under it. That single move tells a reviewer everything. The whole slide got reverse-engineered from a big number, not built from real customers.
Calculate SOM bottom-up from year-one reachable customers
Calculate SOM bottom-up, starting from the customers you can actually reach and the price they will actually pay. Bottom-up means you build from what you know and scale up, instead of taking a giant industry figure and slicing it. Antler notes investors generally prefer the bottom-up method for exactly this reason: it proves you can sell, not just that the market exists (Antler, 2026).
Say you’re building scheduling software for independent physiotherapy clinics. Plug in your own numbers, but here’s the shape of it:
- Start with reachable customers. Through one named channel, say a partnership with a clinic-management platform, you can put your product in front of 400 clinics in year one.
- Multiply by a realistic price. Your annual contract value is $3,000 per clinic. That’s a $1.2M SOM: the money you can plausibly earn from customers you can actually touch.
- Widen to SAM, then TAM. All independent physio clinics in your launch markets, say 12,000 of them, are your SAM at $36M. Every allied-health practice worldwide that could use scheduling, say 250,000, is your TAM at $750M.
| Layer | Illustrative math | Result |
|---|---|---|
| TAM | 250,000 practices × $3,000 | $750M |
| SAM | 12,000 clinics in launch markets × $3,000 | $36M |
| SOM | 400 reachable clinics × $3,000 | $1.2M |
Those inputs are placeholders. Swap in your own counts and price, and cite where each count came from. The discipline is what matters: every layer traces back to a number you can defend out loud. It’s the version we ask founders to build first.
Top-down or bottom-up: which market sizing do investors trust?
Investors trust bottom-up for the SOM and tolerate top-down for the TAM. Top-down starts from an industry report and narrows down; bottom-up starts from your price times your customers and scales up. Both belong on the slide, but they answer different questions, and a reviewer weights them differently. The same split runs through your revenue numbers, which we break down in top-down vs bottom-up forecasting.
| Dimension | Top-down | Bottom-up |
|---|---|---|
| Starts from | An industry report TAM | Your price × reachable customers |
| What it proves | The market is big | You can actually sell |
| How a reviewer reads it | ”Did you just Google this?" | "You have done the work” |
| Best used for | The TAM ceiling, as context | The SOM, the number that counts |
The real credibility test is triangulation. Build the SOM bottom-up, size the TAM top-down, and check that the two land in the same order of magnitude. If your bottom-up math implies a $40M market and your top-down TAM is $900B, one of them is wrong, and the investor will assume it’s you.
Build the number twice, from both directions. When bottom-up and top-down agree, the slide stops being a guess and starts being evidence.
We flag the mismatch constantly. It’s the quiet tell that a founder built the slide backward from a number they wanted to show.
Why does “1% of a huge market” get your deck flagged?
The “1% of a huge market” claim gets flagged because it’s a substitute for market sizing, not an example of it. You’ve seen the sentence: “The market is $50B. If we capture just 1%, that’s $500M.” Every investor has read that exact line in thousands of decks, and it reads as shorthand for “I skipped the bottom-up work.” It’s the line we quote back to founders more than any other on this slide.
The stakes are higher than founders think. Qubit Capital reports that 42% of startups collapse because they misread market demand, and that 55% of pitch decks reviewed in 2024 lacked adequate market analysis (Qubit Capital, 2024). Waveup estimates that 70% of VC rejections cite an unclear market size (Waveup, 2026). Market sizing isn’t a formality. It’s the slide where a reviewer decides whether you understand your own business.
Most common market-slide flag
"1% of a $50B market" with no bottom-up math under it. It signals you sized the market backward from the number you wanted, and it is the fastest way to lose a room that spends seconds per slide.
Qubit puts the tension well: one bloated TAM and you sound naive, one tiny SAM and you look unambitious (Qubit Capital, 2024). The way out of that squeeze is the SOM. A grounded, defensible obtainable number lets you show ambition in the TAM without losing credibility, because the money you are actually chasing is real. This is the same pattern our pitch deck grader marks down hardest: vague top-down sizing costs more points than any design flaw.
Not sure if your market slide reads as evidence or theater? Get a second read before an investor does.
How much market math a pre-seed deck actually needs
A pre-seed deck needs a defensible SOM and a plausible ceiling, not a five-year model of the whole market. The depth of market math scales with your stage, and building the wrong depth wastes weeks. At pre-seed, investors underwrite whether you can reach the first customers at all. At seed and Series A, they interrogate how the SAM opens up as you grow.
Here’s my honest take after reviewing decks daily. Most pre-seed founders should delete the trillion-dollar TAM headline and lead with the bottom-up SOM, because the big number is the part a reviewer trusts least. The SOM is what proves you can start.
StartWise's position
The market slide is won on the SOM, not the TAM. A reviewer can tell in one line whether the number was built bottom-up or borrowed, and a defensible small number beats an indefensible huge one every time.
Match the depth to the stage. A pre-seed slide needs three clean numbers and a named wedge you can reach now, the same discipline we lay out in our pre-seed pitch deck examples. Save the driver-based growth story for seed, where it belongs next to a real financial model investors want to see. At pre-seed, showing you can win 400 clinics beats claiming you will own an industry.
What belongs on the market slide, and what goes in the appendix?
The market slide should lead with one clean SOM number, show the SAM and TAM behind it, and send the sources to the appendix. Investors spend about 15 seconds on a single slide, and 23 seconds on your first one, across the 3,000 decks Papermark analyzed in 2024 (Papermark, 2024). Your market slide has to read in one glance.
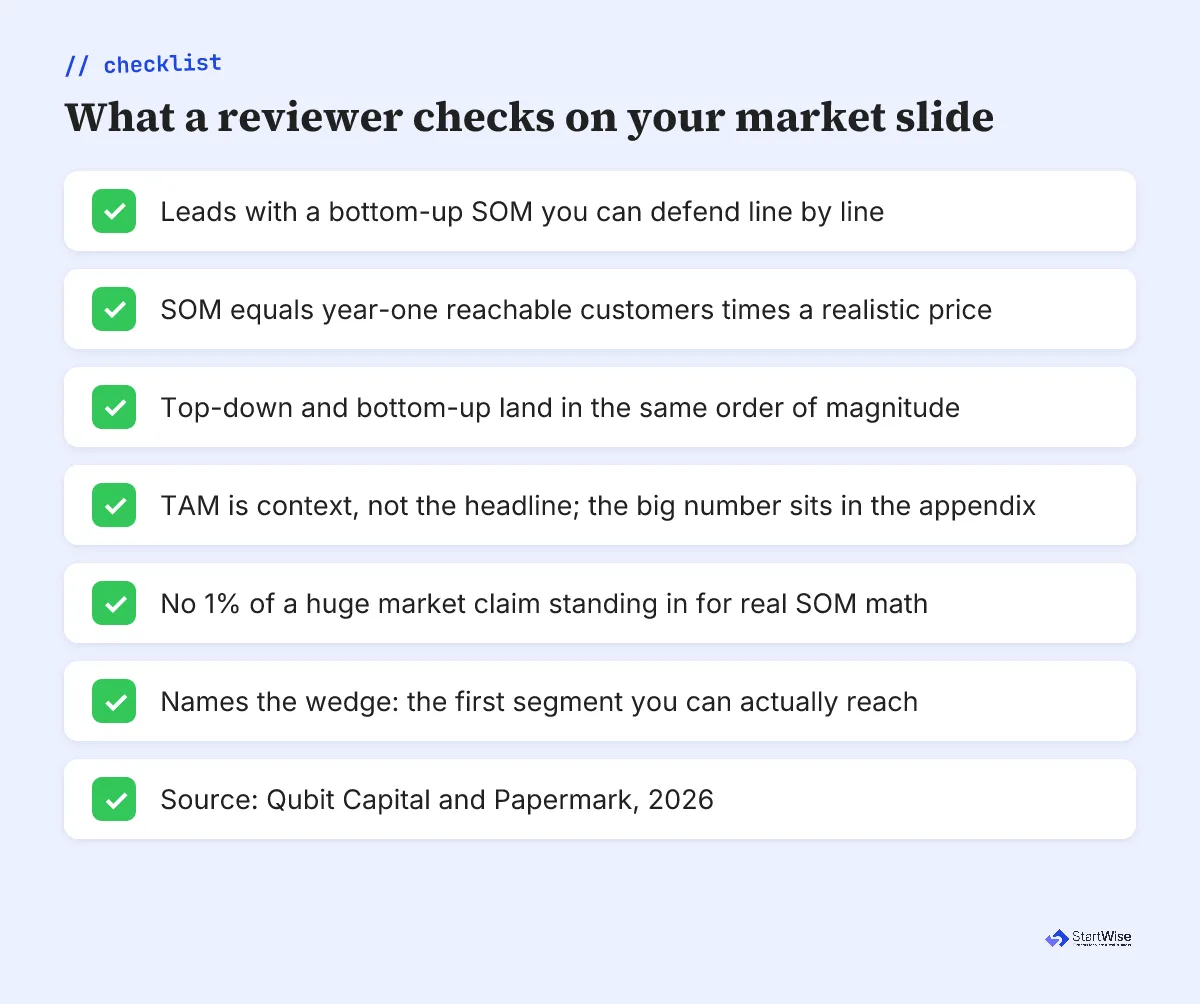
So design it for the skim. Put the SOM front and center as the number you’re chasing now. Use the classic three nested circles only if they stay legible; a reviewer won’t zoom in. Anything a partner would only check during diligence, your source links, your segment breakdowns, the top-down and bottom-up cross-check, belongs in an appendix slide, not the main one. It’s the layout we push hardest in review.
That skim reality is why the bottom-up SOM wins. It’s one number, and it survives 15 seconds. The trillion-dollar TAM needs a paragraph of caveats to be honest, and you don’t have a paragraph. You’ve got a glance, which is the same constraint that governs how many slides a pitch deck needs in the first place.
What to do this week
Rebuild your market slide bottom-up before your next investor email. It’s a two-hour job, and it fixes the flag we see most.
- Write your SOM first. Count the customers one named channel can reach in year one, multiply by your real annual price, and make that the headline number.
- Widen to SAM and TAM. Layer up to the geography you can serve, then the whole market. Cite where each count comes from.
- Run the triangulation check. Size the TAM top-down too, and confirm both methods land in the same order of magnitude. If they don’t, fix your assumptions, not your slide.
- Move the sources to the appendix. Keep the main slide to the three numbers and a one-line wedge, so it reads in 15 seconds.
Do that, and your market slide stops being the one a reviewer skips. It becomes the one that proves you know exactly who you’re selling to first.