
 By
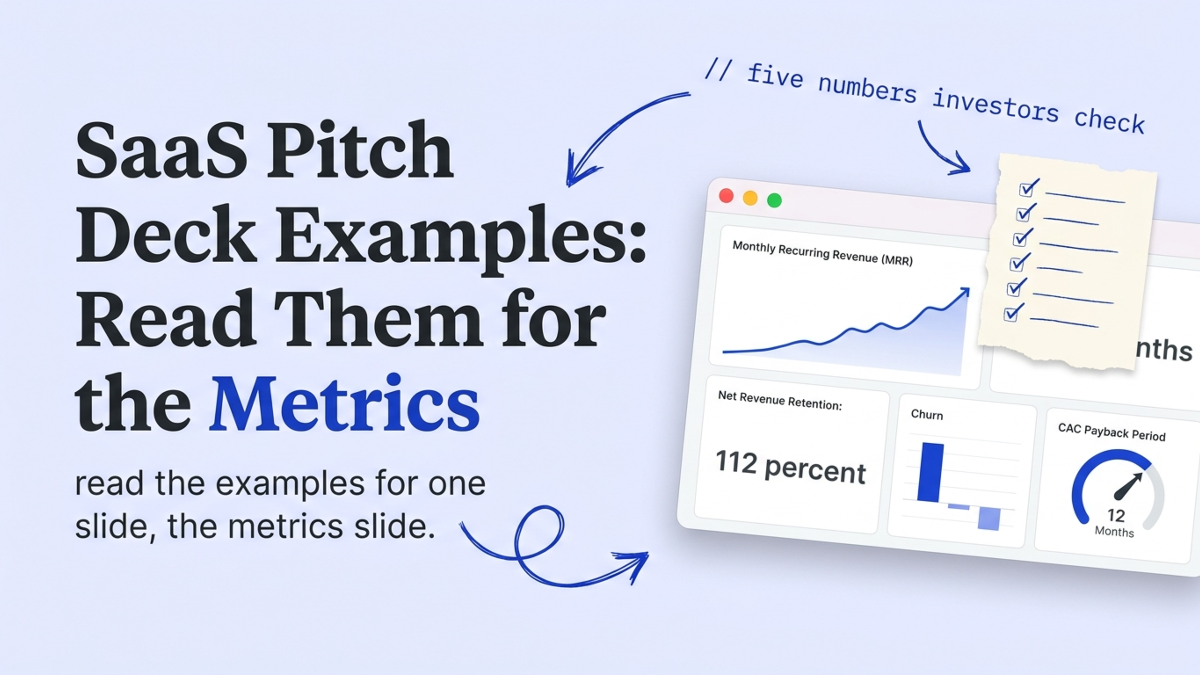
SaaS pitch deck examples are everywhere, and most of them teach the wrong lesson. The galleries that rank for this search hand you finished decks from companies that already raised $70 million, with no notes on which slide did the work. At StartWise we review founder decks every day, and a SaaS deck differs from every other deck on exactly one slide: the metrics slide. That’s the slide worth studying in any example. Here’s what belongs on it, the 2026 bar for each number, and how to read the famous decks for that slide instead of their design.
What makes a SaaS pitch deck different from any other deck?
A SaaS pitch deck differs from a generic deck on one slide and one slide only: the metrics slide. The cover, problem, solution, market, team, and ask sections are the same slides every founder builds, in roughly the same order. What changes is the recurring-revenue math an investor expects you to put on the table.
We see the same thing in review every week. A SaaS founder copies a famous deck’s flow, nails the design, then drops vanity numbers on the one slide that’s supposed to carry the business. Total signups. App downloads. A logo wall with no revenue behind it.
The shared slides still matter, and we’ve written about how many slides a pitch deck needs and what each one does. But on those slides a SaaS deck and a marketplace deck look nearly identical. The metrics slide is where the category actually shows. It’s the one place a generic template fails a SaaS founder, because the template can’t know that an investor reading a SaaS deck is hunting for net revenue retention, not a download count.
Which metrics belong on a SaaS pitch deck?
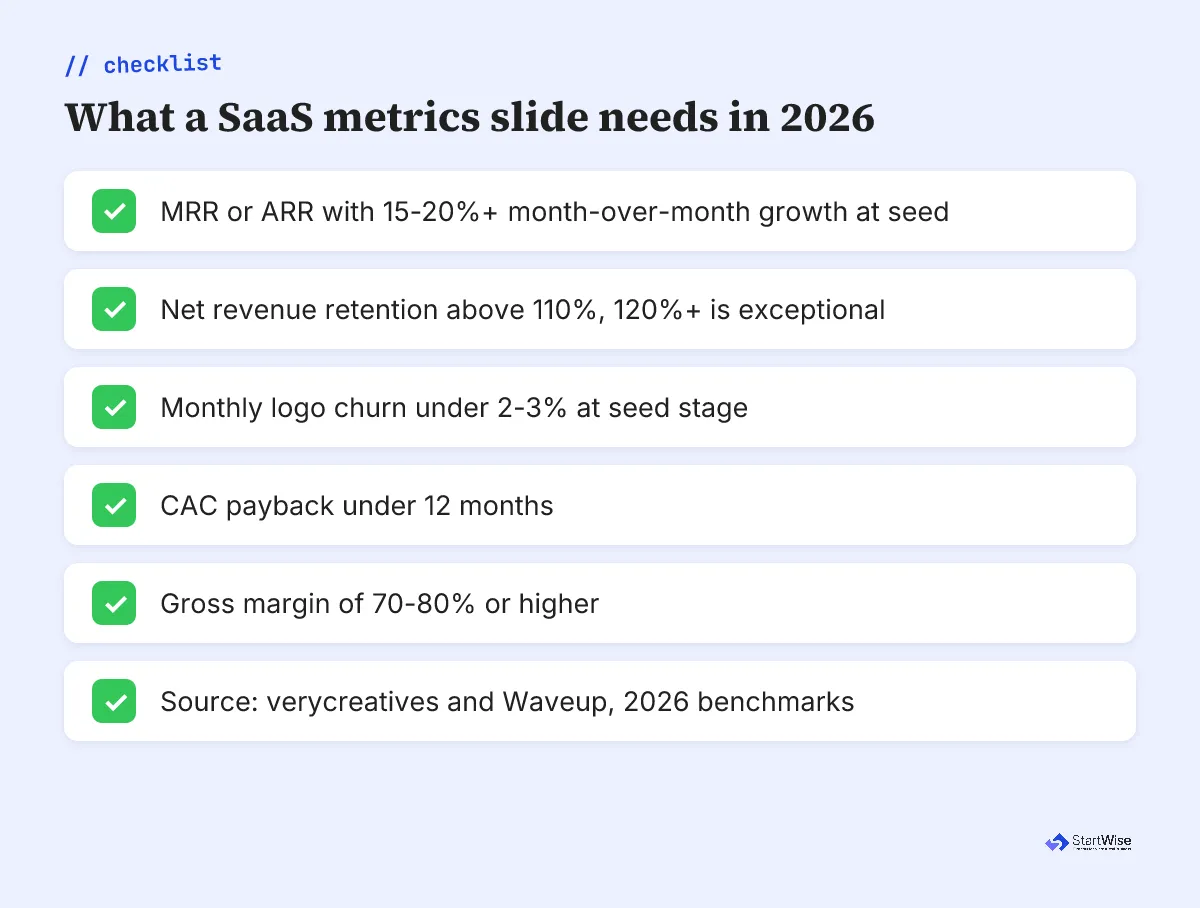
Five numbers belong on a SaaS metrics slide, and each one answers a question an investor would otherwise ask out loud: how fast you grow, whether customers stay, whether they leave, how fast acquisition pays back, and whether the model is efficient.
| Metric | What it shows | The 2026 bar investors want |
|---|---|---|
| MRR or ARR growth | How fast revenue climbs | 15-20%+ month over month at seed |
| Net revenue retention | Whether customers expand | Above 110% at seed, 120%+ is exceptional |
| Logo churn | Whether customers leave | Under 2-3% monthly at seed |
| CAC payback | How fast acquisition pays back | Under 12 months |
| Gross margin | Whether the model is efficient | 70-80%+, below 60% draws scrutiny |
Most of those bars come from verycreatives’ 2026 SaaS benchmark; the CAC payback line is Waveup’s 2026 cut. Net revenue retention, often shortened to NRR, is the headline. It measures whether your existing customers spend more over time than the ones who leave take with them, and verycreatives calls it the most reliable single signal of product-market fit a SaaS investor can read in 2026.
Two ratios sit just behind those five and turn up the moment an investor likes what they see. verycreatives lists an LTV:CAC of 3:1 or better as the line that proves the economics work, with a payback period under 18 months by Series A. Both say the same thing in different words: your sales motion pays for itself instead of burning the round you just raised.
The metric we most often see missing is churn. Founders show the numbers that flatter them and quietly drop the one that doesn’t. An investor notices the gap right away. Silence on churn reads as bad news, not no news, so a mediocre churn figure shown plainly beats a blank where the number should be.
What do the famous SaaS deck examples actually show?
The famous SaaS deck examples show metrics slides built on exactly these numbers, years before it became standard advice. Klipfolio broke down the metrics slides of eight SaaS decks: Front showed MRR growing 5.4 times in 12 months, Mixpanel paired a three-year growth rate with sales payback measured in months, and Buffer put month-over-month user growth next to its churn percentage. Intercom’s $600,000 seed deck carried no metrics at all, because in 2012 it didn’t have them yet.
That’s how we read an example in a review: go to the metrics slide first and ask what numbers earned the round.
Here’s where the galleries mislead you. Failory’s SaaS collection is full of decks from companies that raised $70 million and up: Hello Heart, Bubble, Starburst. Beautiful decks, every one. They’re useless models for a founder raising a first round, because those metrics slides describe a company you’re three rounds away from being.
Copy a $70-million deck’s metrics slide and you’ve written a check your traction can’t cash.
So read the examples for structure and order, and build your own numbers. A seed deck’s metrics slide and a Series D deck’s metrics slide answer the same questions at wildly different scales.
Not sure your SaaS metrics slide reads in one glance? Get a free, slide-by-slide review of your deck with a concrete fix list, in minutes.
What goes on the metrics slide before you have revenue?
Before you have revenue, the metrics slide shows a traction slope, not a metrics table. Most pre-seed SaaS founders don’t have NRR or CAC payback yet, and inventing them is worse than admitting the gap. So you show the early signals you do have, and you show them moving.
Waveup’s 2026 benchmark for a B2B SaaS seed round is modest on purpose: roughly $10,000 to $30,000 in MRR, or three to five enterprise pilots, with your hero metric up at least 2x in six months. At pre-seed you’re often below even that. That’s fine. What an investor wants is a believable slope, a waitlist converting, pilots signing, weekly active use climbing, with a mechanism behind the climb.
We tell founders to plot the line and name the engine driving it. A chart that goes up because of one webinar isn’t traction; a chart that goes up every week because each customer refers the next one is.
Stack the signals you have rather than reaching for one you don’t. A 400-name waitlist converting to paid at a steady clip, two signed pilots with named logos, and usage climbing week over week add up to a credible story, even with zero NRR to report. The famous SaaS decks earned their metrics slide over years; yours earns attention by showing the slope is real and the reason behind it will hold.
StartWise's position
On a SaaS deck, traction is a slope before it's a number. Early founders fill the metrics slide with cumulative totals, total signups and total downloads, when an investor at this stage is reading the rate of change instead. A line climbing every week with a mechanism you can name out loud carries more weight than a big static figure. With about 3.2 minutes of attention on the whole deck ([Papermark, 2024](https://www.papermark.com/pitch-deck-metrics)), a number that doesn't move is a number that hasn't earned its slot.
The pre-revenue version of every slide deserves its own walkthrough, and we built one: see what reviewers flag on pre-seed pitch deck examples for the slide-by-slide before-traction playbook.
Where to find real SaaS pitch deck examples
Real SaaS pitch deck examples live in a handful of public galleries, but read every one for the metrics slide, not the format. Klipfolio’s breakdown is the rare example that shows you the metrics slide itself, with the numbers each company chose. Failory hosts more than 50 full decks if you want to see whole stories end to end.
The example we point founders to is never a static gallery on its own. A finished deck with no notes tells you what a company chose, not why it worked or where it would get flagged. Read with three questions in hand:
- Open the metrics slide first. If there isn’t one, the example can’t teach you the thing that matters.
- Note which of the five numbers they show, and which they leave off.
- Check the stage. A Series D deck’s metrics slide is a different planet from your seed one.
For the cross-industry classics, Airbnb and Uber and the rest, what to copy and skip in pitch deck examples reads them the same disciplined way. The mechanics travel across industries; the specific numbers never do. If you’re building in AI, fintech pitch deck examples reads them for the regulation slide, healthcare pitch deck examples reads them for the reimbursement slide, and ecommerce pitch deck examples reads them for the unit-economics slide.
What to do this week
This week, rebuild your SaaS metrics slide before you touch the design on any other slide. It’s the slide we fix first in almost every SaaS review, because it’s the one that separates a deck that looks funded from one that gets funded.
- Put net revenue retention on the slide, or if you’re pre-revenue, the closest signal to it you have.
- Show churn. Hiding it reads worse than a middling number.
- Add your month-over-month growth rate, not a cumulative signup total.
- Include CAC payback and gross margin if you have them; if you don’t, say so and show the slope instead.
- Open three example decks, jump straight to their metrics slide, and copy the structure, never the numbers.
Then put it in front of someone who reads SaaS decks the way investors do, before an investor does. On a SaaS deck, the gap between polished and fundable is almost always this one slide.