
 By
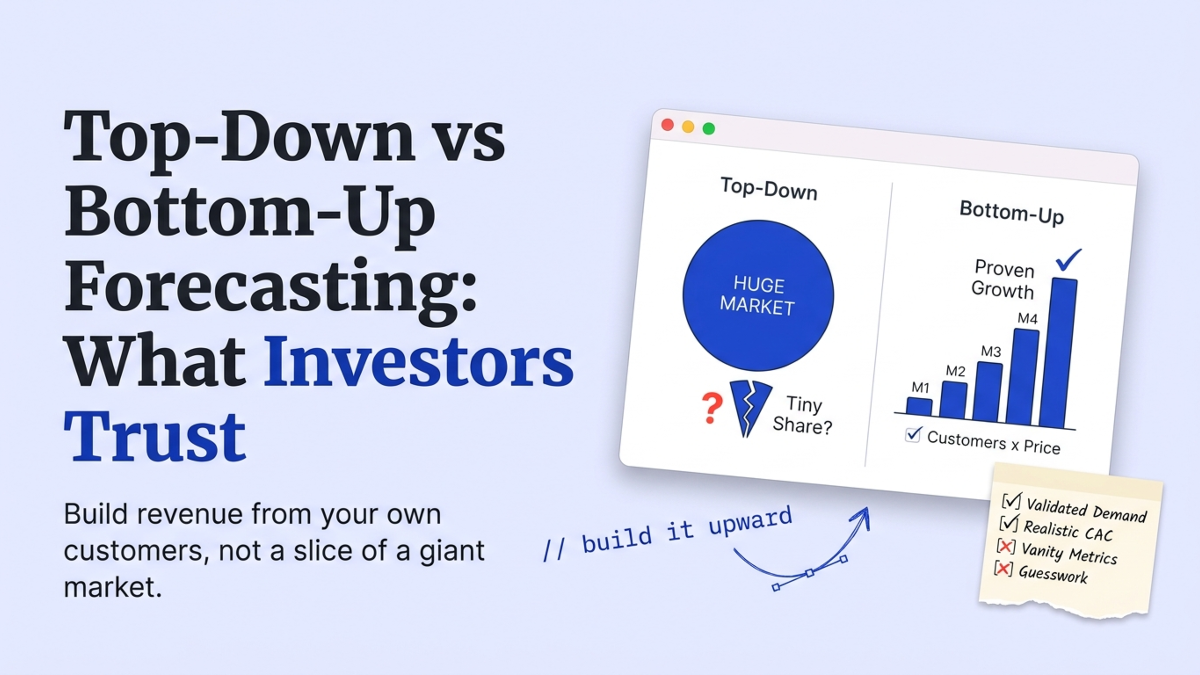
Top-down forecasting starts with a big market number and slices off a share you hope to win. Bottom-up forecasting works the other way: you start with your own customers, price, and channels, then add them up month by month. The gap between the two is where most pre-seed founders lose an investor’s trust. We review founder decks and models at StartWise every day, and the projections are where a top-down fantasy gets caught in seconds. Investors spent about 2 minutes 30 seconds on the average deck in 2024, according to DocSend. Your forecast has to survive that read.
What’s the difference between top-down and bottom-up forecasting?
The difference is the starting point. Top-down forecasting begins with a market size, say a $10 billion market, and assumes you capture some percentage of it. Bottom-up forecasting begins with one customer and one price, then multiplies out by how many you can actually reach through a real channel. Same goal, opposite directions.
One of them you can defend line by line. The other you mostly hope.
| Top-down | Bottom-up | |
|---|---|---|
| Starts from | Total market size (TAM) | One customer times price |
| Inputs | Market reports, a target share | Reachable accounts, conversion, channels |
| Best for | The TAM ceiling, a new category | Revenue, runway, hiring |
| Breaks when | The share is a guess | You ignore the market ceiling |
TAM here means total addressable market, the whole pie if everyone who could ever buy did. Top-down asks what slice of that pie you’ll take. That question is easy to answer and impossible to prove, which is exactly why it makes investors nervous. In the decks we review, the top-down version shows up far more often, and it’s the one that stalls the conversation.
Why do investors distrust a top-down forecast?
Investors distrust top-down forecasts because the number that drives everything, your market share, is almost always a guess dressed up as a projection. A slide that claims 1% of a $50 billion market equals $500 million in revenue says nothing about whether you can sell to ten customers. The data backs the skepticism. Qubit Capital reports that 55% of pitch decks reviewed in 2024 lacked adequate market analysis, and that 42% of startups fail because they misread market demand (Qubit Capital, 2024).
We flag more revenue projections for a shaky top-down number than for almost any other line on the slide. Here’s the part founders miss. Investors don’t study your forecast. Papermark’s 2024 analysis of roughly 3,000 decks found the average deck gets about 3.2 minutes total, and close to 15 seconds per slide after the opening one (Papermark, 2024). Your five-year hockey stick gets a 15-second glance. A round, top-down number like “$500M by year five” is precisely the kind of claim a skeptical reader stops on and starts poking.
A top-down forecast answers a question no investor asked: how big could this be if everything breaks your way?
StartWise's position
A five-year top-down revenue forecast is theater. A bottom-up build from the customers you can reach next year tells an investor more than any slice of a giant market, and if your bottom-up math can't survive a napkin check, it's already hurting you.
So a prettier chart won’t save it. A credible forecast gets built from the ground up, driver by driver.
How to build a bottom-up forecast in four drivers
A bottom-up forecast comes down to four drivers you can actually estimate: how many customers you reach, what they pay, how many convert, and how fast you hire to serve them. Get those four honest and the revenue line builds itself. We’ve watched founders overstate the middle two more than any other input, so slow down there.
- Reachable customers. Count the accounts you can name a channel to, not the whole market. If one partnership puts you in front of 400 clinics, that’s your top of funnel, not six million businesses.
- Price. Use a number you’ve charged or quoted, not a blended industry average that flatters the model.
- Conversion. Apply an honest rate at each step, lead to demo, demo to close. Early founders round these up, and it compounds.
- Hiring and cost. Tie each new hire to the revenue it pays for. This is where your runway math actually lives.
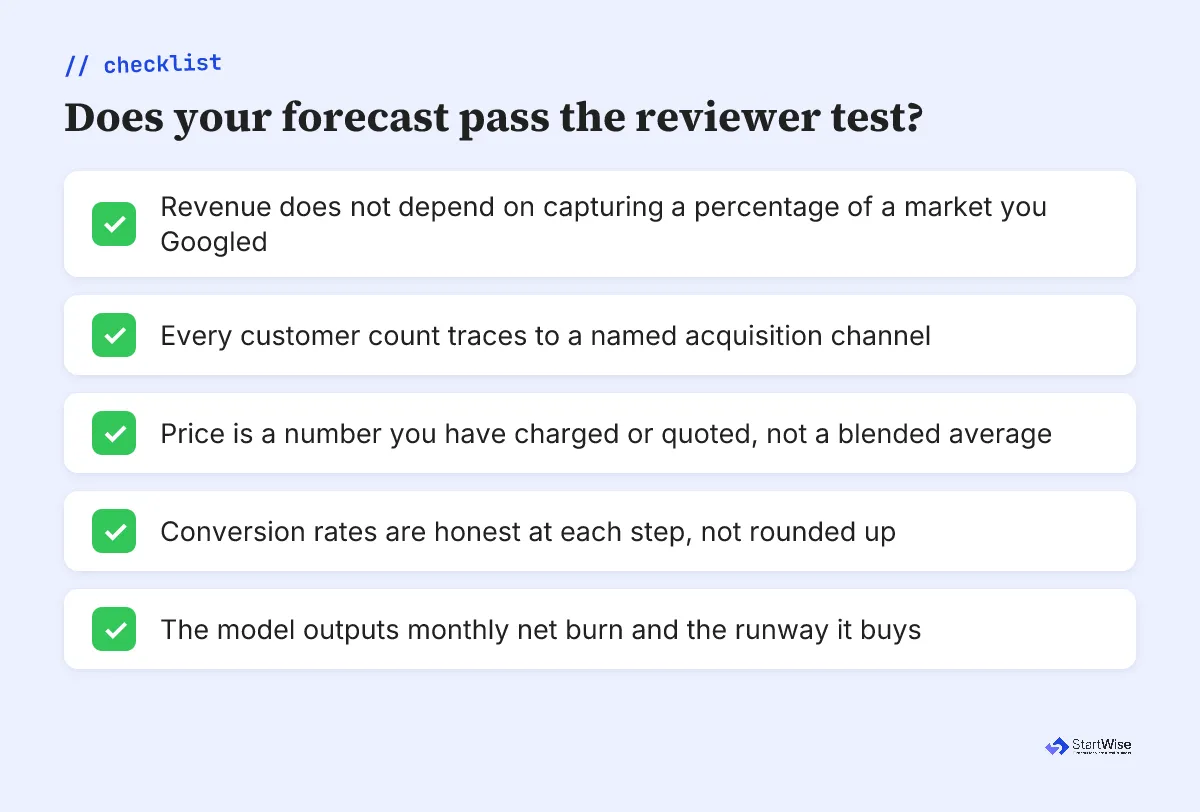
Forecastr recommends targeting an LTV to CAC ratio of at least 3 to 1 and planning 18 to 24 months of runway at pre-seed (Forecastr, 2026). LTV is the lifetime value of a customer; CAC is what you spend to acquire one. A bottom-up model is really a test of whether those two numbers work. A top-down model doesn’t even ask the question. If you want the mechanics, our startup financial model template walks the same four drivers cell by cell.
Your projections land on one slide investors read in about 15 seconds. Make sure it reads clean.
When should you use top-down forecasting?
Top-down forecasting earns its place in exactly one spot: framing the ceiling. When you’re sizing a brand-new category with no close comparable to build from, a top-down TAM gives an investor a sense of scale before you zoom into your own numbers. That’s a legitimate job, and it’s the only one we’ll defend.
Use top-down when you need to:
- Set the outer boundary of the opportunity on your market slide.
- Sanity-check a bottom-up number that feels too big or too small.
- Frame a category so new that customer-level comparables don’t exist yet.
Everywhere else, it’s the wrong tool. Building a TAM SAM SOM example the right way means leading with the bottom-up SOM and using top-down only as the outer ring.
What belongs in the deck versus the model?
The deck gets the conclusion; the model gets the math. On the financials slide, show three or four bottom-up lines an investor can read at a glance: revenue, gross margin, monthly burn, and the runway your raise buys. The full driver-by-driver build lives in your financial model, which an investor asks for only after the deck earns a second look.
This split matters because the two documents get read at completely different speeds. Your financials slide gets seconds. Your model gets scrutiny, but only later, and only if the slide worked. What investors want to see there shifts by stage, which we cover in what financial model investors want.
Put the number on the slide. Keep the build in the sheet. Never make an investor reverse-engineer one from the other.
What to do this week
Open your current forecast and find the market-share number. If your revenue depends on capturing X% of a market, you have a top-down forecast, and a reviewer will read it as fiction. This is the single fix we’d make first on most pre-seed decks. Rebuild it from the four drivers instead:
- Write down the customers you can reach through one named channel next year.
- Multiply by a real price and an honest conversion rate.
- Roll it forward monthly, then subtract costs to get net burn and runway.
Then do the top-down check last, not first. If your bottom-up total and your TAM ceiling land in the same universe, you’re ready. If they don’t, you just found the hole an investor would’ve found for you.