
 By
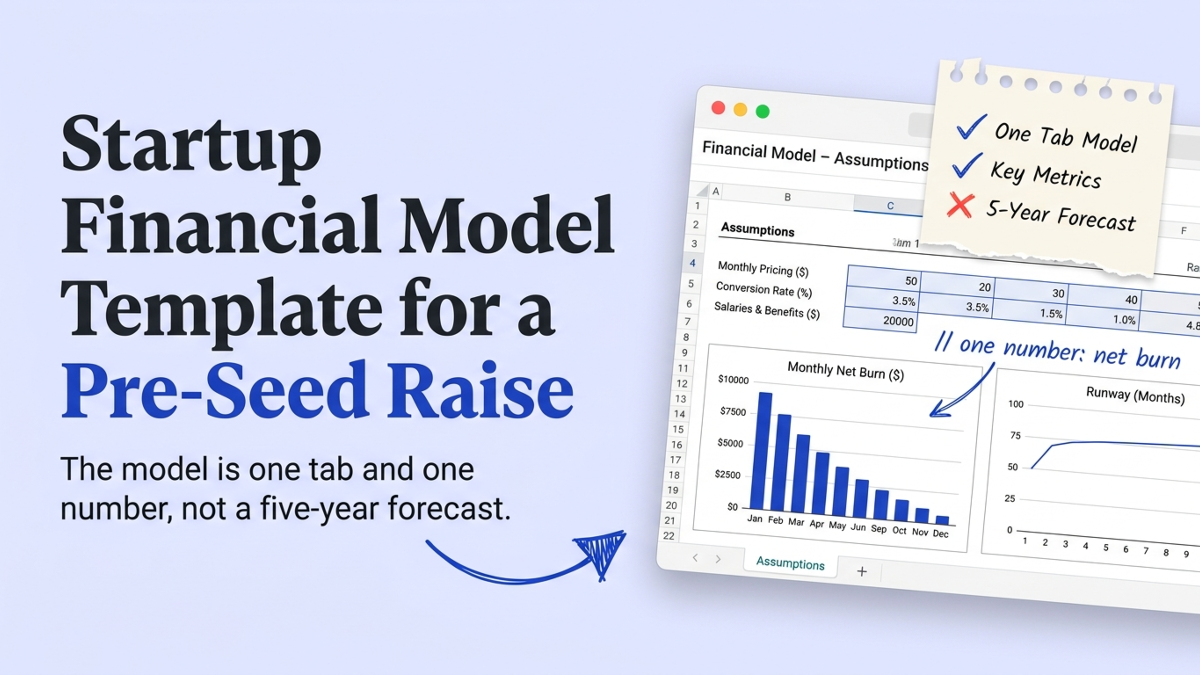
A startup financial model template is the spreadsheet that turns your investor-ready business plan into numbers: what you charge, who you hire, and how fast the cash runs out. Most templates you download are built for a Series A company, with five-year forecasts and three linked financial statements. At pre-seed, that is the wrong document. We review the models and decks founders send before they raise, and the ones that work are small: one tab of assumptions, an 18-to-24-month cash plan, and a single net-burn number the founder can say out loud.
What goes in a startup financial model template?
A pre-seed template needs five parts, and none of them is a five-year forecast. You build a tab of assumptions, a bottom-up revenue plan, an operating-expense list, a hiring plan, and a cash section that outputs monthly net burn. That’s the whole model. Everything else is a later-stage add-on.
Here is the structure, top to bottom:
- Assumptions tab. Every price, conversion rate, and salary in one place, so a reviewer can change one cell and watch the model react.
- Revenue build. New customers times price, month by month, built up from real channels.
- Operating expenses. Software, marketing, legal, and admin, kept separate from payroll.
- Hiring plan. The roles the raise pays for, with start months and honest salaries.
- Cash and runway. Opening cash, monthly net burn, and the month you hit zero.
The assumptions tab is the one that matters most. It’s where an investor tests your thinking, because they can flex a single number and see whether the model holds. The models we flag as weak usually hard-code numbers deep inside formulas, so nobody can pressure-test them.
A worked assumptions tab looks like this. Swap the placeholders for your own numbers and the rest of the model builds off these cells.
| Input | Example placeholder | Where the number comes from |
|---|---|---|
| Price per customer | $50 per month | Your pricing page or 3 sales calls |
| Monthly new customers | 20, growing 15% | Your current pipeline, not a market slice |
| Gross margin | 75% | Cost to serve one customer |
| Founder and early salaries | $60K to $120K each | What you will actually pay, below market |
| Opening cash | $150K | Your bank balance the day you model |
Your pre-seed model is smaller than the template you downloaded
The template you downloaded is probably built for a company three rounds ahead of you. EY’s startup modeling guide recommends three to five years of forecasts and three linked statements, and even notes it will not share a template because so many already exist. That’s the right build for a Series A raise. At pre-seed, an investor wants 18 to 24 months and proof you can think in numbers, not a five-year prediction nobody believes.
Vestd puts it plainly: early-stage investors “probably aren’t looking for watertight financial forecasts,” but they do want clarity. So the pre-seed job is different. You’re showing judgment, not accuracy.
The mistake I see most is a founder proudly presenting a five-year model when the real question is whether they survive the next 18 months. Here’s what to build now and what to leave for later.
| Element | Build now, pre-seed | Skip until later |
|---|---|---|
| Time horizon | 18 to 24 months, monthly | 3 to 5 years, annual |
| Statements | Cash plus a simple P&L | Full three-statement model |
| Revenue | Bottom-up from real channels | Top-down market share |
| Scenarios | One base case | Best, base, worst toggles |
5 years
The forecast length most templates default to, and the quickest way to signal you built the wrong document at pre-seed. Investors want 18 to 24 months. EY, The Ultimate Guide to Financial Modeling for Startups
How do you build the revenue tab bottom-up?
Bottom-up means you build revenue from things you can count, the opposite of taking a share of a market you Googled (top-down vs bottom-up forecasting covers why investors trust it). Forecastr’s pre-seed guide plans for 18 to 24 months of runway modeled monthly, and says a good model focuses on the three or four factors that truly drive growth. It warns that claiming one percent of a ten-billion-dollar market convinces nobody. So start with the drivers you can actually defend:
- How many prospects you reach each month, and where they come from
- What share of them convert, based on real calls rather than hope
- What each paying customer is worth, against what they cost to acquire
That last pair is the one investors probe. Forecastr’s rule of thumb: if lifetime value is three times customer acquisition cost or better, that’s a great sign. Build those cells, multiply up, and the revenue line writes itself. If you sell subscriptions, that revenue tab becomes an MRR waterfall, and the unit-economics benchmarks shift with it.
Then everything funnels into one output. Subtract total monthly spend from monthly revenue and you get net burn. Divide your cash by that burn and you get runway, the month the money runs out. When we review a model, we go straight to that number, because it’s the one an investor will actually use.
A pre-seed model has one job: output a monthly net-burn number you can defend out loud.
How does the model become one slide investors read?
The whole model ends up as one slide, and investors barely stop on it. Papermark’s 2025 report, drawn from about 3,000 decks shared in 2024, clocked 3.2 minutes on an average deck, 23 seconds on the first slide, and roughly 15 seconds on each slide after. Your financials slide gets about 15 of those seconds.
So the model’s output has to survive a glance. The financials slides I flag hardest are the ones that can’t be summarized in a single number: a five-year hockey stick with no burn figure, or an ask with no runway math behind it. A reviewer reads that as a founder who hasn’t done the thinking.
Match the slide to what investors want by stage, and the model earns its 15 seconds. One number, defensible, tied to a milestone. That’s the bar, and it’s lower than the five-year model most founders waste a week on. Reading only your deck titles should already tell the story before anyone opens the spreadsheet.
Got the model and the slide it feeds? See what a reviewer would flag on your financials slide before an investor does. Free, slide-by-slide, in minutes.
Will a spreadsheet sprawl, or is it good enough?
A spreadsheet is the right tool for a pre-seed model. Dedicated modeling platforms warn about “spreadsheet sprawl,” the version chaos of Model_v3_FINAL files across a finance team, and they’re not wrong about that problem. You just don’t have it yet. At pre-seed you’re one or two people with no revenue to reconcile and no board asking for live scenarios.
The pre-seed models we review live happily in a single Sheet. You outgrow the spreadsheet when three things become true:
- You have real monthly revenue to reconcile against actuals
- More than one person edits the model every week
- Investors or a board want live best, base, and worst scenarios
Until then, Google Sheets or Excel is the correct choice, not a fallback you apologize for. Buying a modeling platform to raise a pre-seed round is like renting a warehouse before you’ve made a sale.
StartWise's position
A pre-seed financial model has one job: produce a monthly net-burn number you can defend out loud. Everything else on the tab that does not move that number is procrastination dressed as diligence.
And that number carries real weight. About 30% of failed startups run out of funding (Upsilon, via Embroker), and 82% of the businesses that closed in 2023 did so over cash-flow problems (Znaki, via Embroker). Net burn is how you avoid becoming either statistic. A founder who knows their runway to the month is a founder who knows when to raise, when to cut, and when to keep going.
What to build this week
Open a blank Google Sheet and give yourself one afternoon. You don’t need a course or a $200 template to get to a model an investor will respect. The founders we see raise fastest treat the model as a thinking tool, not a homework assignment.
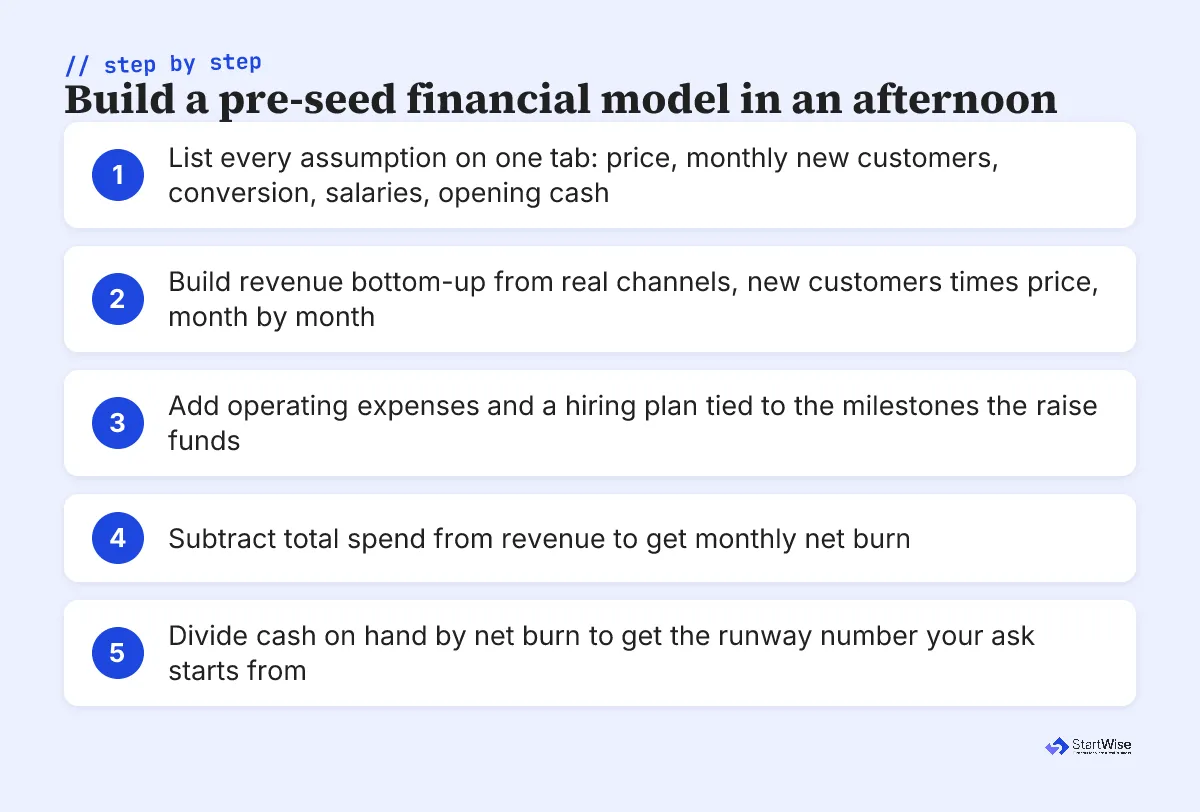
- Write every assumption on one tab: price, monthly new customers, conversion, salaries, opening cash.
- Build revenue bottom-up: new customers times price, month by month, for 18 to 24 months.
- List operating expenses and the two or three hires the raise pays for.
- Subtract total spend from revenue to get monthly net burn.
- Divide opening cash by net burn. That month is your runway, and your ask starts there.
Then read your own model the way an investor will: one glance, one number. If it doesn’t survive that, no template will save it.