
 By

The traction slide is the one page in your pitch deck that answers a single investor question: is this actually working yet? It shows the metrics, growth, and proof that your idea has momentum. Most guides hand you a checklist of numbers to include. Few say the harder part out loud: investors read this slide in about 15 seconds, and they read the slope far more than the size. We review founder decks before they raise, and traction is where the most fixable mistakes hide.
What goes on a pitch deck traction slide?
A pitch deck traction slide shows the evidence that your business is moving: one headline metric, its growth rate, and two or three proof points that back it up. That’s the whole page. One number leads, the rest support, and everything points at the same story of momentum.
The headline is whatever best proves demand for what you sell. For a SaaS product that’s usually monthly recurring revenue, or MRR, the subscription income you book each month. For a marketplace, the headline is gross merchandise volume, the total value flowing through the platform. Pre-revenue, it’s the strongest demand signal you have, and we’ll get to what those are.
Under the headline, add the trend and a few proof points. A growth rate. A retention number, a marquee customer, a press mention a stranger would recognize. Waveup, a deck-strategy firm that says it has rebuilt more than 800 decks, frames the job as one hero metric supported by two or three reinforcing points.
The decks we review that land meetings do one thing here. They pick a single hero number and refuse to bury it.
How long do investors actually look at it?
Investors look at your traction slide for only a handful of seconds. Papermark’s 2025 analysis of 3,000 pitch decks clocked an average of about 15 seconds per page after the opening slide, with 3.2 minutes spent on the entire deck. Fifteen seconds is one glance. It’s the length of a held breath.
That number should decide your design. If a partner gets a single glance, your headline metric has to be legible from across a room, big and unmissable, with the trend readable at speed. Waveup, drawing on DocSend’s 2025 engagement data, reports investors spend roughly three times longer on the traction slide than any other page in a seed deck. So the slide does earn attention. Don’t waste it on a chart nobody can parse in a glance.
~15 sec
The average time investors spend on a deck page after the opening slide, so your traction number has one glance to register. Papermark 2025 analysis of 3,000 pitch decks
Here’s the test we run in reviews. We flash the slide for ten seconds, then ask what the number was. If you can’t answer, no investor skimming forty decks on a Sunday will either.
What counts as traction before you have revenue?
Before revenue, traction is any credible signal that people want what you’re building and will act on it. A waitlist with real signups, signed letters of intent, paid pilots, pre-orders, or an early cohort that keeps coming back all count. What doesn’t count: downloads, page views, and social followers with no behavior behind them.
Deckary’s stage guide treats a waitlist above 1,000, five to ten letters of intent, and named pilot customers as legitimate pre-seed traction. The bar isn’t a big number. It’s a real one, tied to a person who did something harder than clicking a like button.
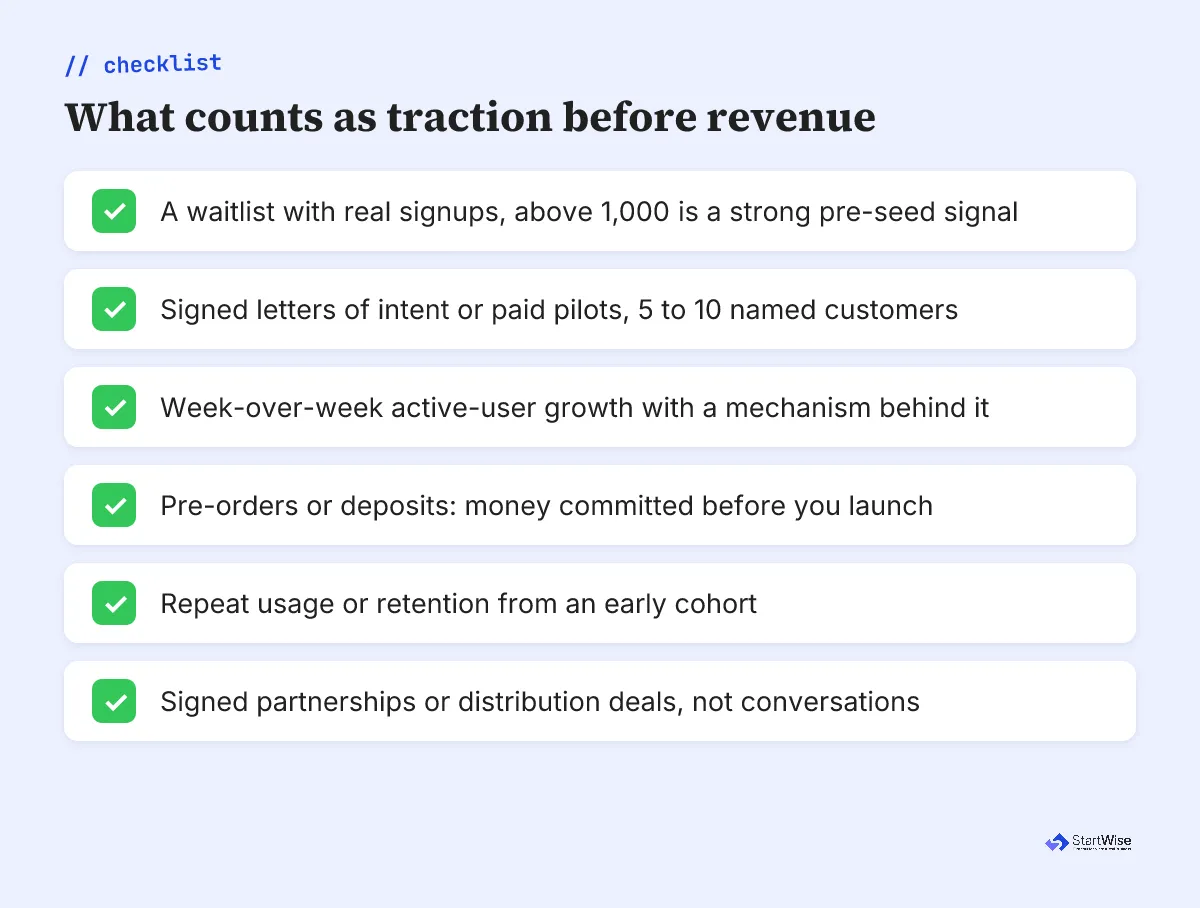
The strongest pre-revenue signal is the one that cost someone something. An email address is cheap. A signed pilot, a deposit, or ten discovery calls that ended in “when can I buy this” cost real effort, and investors know it. We keep seeing founders lead with 12,000 downloads and bury the three enterprise letters of intent that actually prove demand. Flip that, and match the nine-slide structure pre-seed reviewers expect.
What traction do investors expect by stage?
What investors expect scales with your stage, because each round buys a different kind of proof. Pre-seed buys belief and one real signal. Seed buys early product-market fit. Series A buys a growth machine that already runs.
| Stage | Traction that clears the bar | Headline metric |
|---|---|---|
| Pre-seed | 1,000+ waitlist, 5-10 LOIs, paid pilots, engaged beta cohort | Strongest demand signal you have |
| Seed | B2B SaaS $10K-30K MRR or 3-5 pilots; consumer ~$50K MRR or 10K weekly actives | MRR with month-over-month growth |
| Series A | Hero metric doubled in 6 months, 12+ months retention, pipeline 2-3x revenue | ARR and net revenue retention |
The seed benchmarks come from Waveup’s 2026 traction guide, and the pre-seed signals from Deckary’s stage breakdown. Use them as a floor, not a promise.
Don’t force your company onto the wrong row. A pre-seed founder showing a Series A metrics grid looks like they misread the round, and a seed founder leaning on a waitlist looks a stage behind (our seed round pitch deck examples walk that bar). The pre-seed decks we review win on one sharp signal and an honest “here’s what we prove next,” not a spreadsheet of numbers they don’t have yet. So when you raise a pre-seed round, show the one thing that’s real.
Show the slope, not the total
The most important thing on a traction slide is direction, not size. A startup at $20K MRR growing 25% month over month tells a better story than one flat at $80K, because early investors are buying the trajectory. Show the slope.
StartWise's position
Traction is a slope, not a number. Pre-revenue founders keep putting absolute counts on the slide, but at pre-seed investors read direction and speed. Week-over-week movement with a believable mechanism beats a vanity total every time.
This is where one chart trick quietly kills good decks. The cumulative total graph, the one that only ever climbs up and to the right, flatters you. It can’t do anything else. Every cumulative chart rises, even a chart for a business losing users every single week, because you can’t un-add a signup that already happened. So plot the incremental adds instead: new users this week, new revenue this month. That version shows the slope, and the slope is the part an investor’s eye is actually tracking.
We flag this constantly. A founder shows 40,000 cumulative signups on a proud curve, we ask for weekly adds, and the last two months are flat. The cumulative chart was doing PR for a business that had stalled. Show the incremental line even when it’s bumpy, because a believable climb with a rough week or two reads as a real company while a suspiciously smooth curve reads as a chart somebody tuned.
One more thing on presentation. Caption the chart with the insight, not the axis. “Weekly signups up 22% since launch” does more work than a tidy legend nobody reads.
A total tells an investor where you are. A slope tells them where you’re going, and that’s the only part they’re buying.
The mechanism matters as much as the shape. A slope with no reason behind it is just a line. Pair the growth with why it’s happening: a channel that’s working (the same one your go-to-market slide names), a referral loop that compounds, a sales motion you can run again next month. The trend we see convince investors is the one a founder can explain in a sentence and expect to keep going, which is exactly what sets up the financials slide that comes right after.
Not sure your traction slide shows the slope an investor is looking for? See what a reviewer would flag before you send it, free and slide-by-slide, in minutes.
What makes a traction slide fail?
A traction slide fails when it shows activity instead of proof. The failures we flag most are vanity metrics with no behavior behind them, a number with no timeframe, and “traction” that’s really just money spent on ads. Each one tells an investor the same thing: this founder can’t separate a real signal from a busy one.
Here’s what a reviewer deflates in a single question:
- A number with no timeframe. “10,000 users” means little without “in how long, growing how fast.”
- A metric with no denominator. 500 signups is great from 600 visitors and grim from 600,000.
- Paid growth dressed as organic traction, where the real story is your ad budget, not demand.
- A cumulative curve hiding a flat recent quarter, which one follow-up question exposes.
The pattern underneath all four is the same. A founder reached for the biggest-looking number instead of the truest one. Investors have seen ten decks this week that did that, so the inflated metric reads as a tell, not a triumph.
What to do this week
You can fix most traction slides in an afternoon, and you can earn a real signal in about two weeks if you’re starting from zero. The founders we watch raise fastest rarely have the biggest numbers. They have one number that’s real and clearly climbing.
- Pick one hero metric that best proves demand, and make it the biggest thing on the slide.
- Swap any cumulative chart for incremental adds per week or month, so the slope shows honestly.
- Cut every number that has no timeframe or denominator. If it can’t survive one follow-up question, it’s noise.
- Starting from zero? Spend two weeks earning a signal: run 15 discovery calls, put up a landing page and drive $100 of ads to measure signup rate, and turn three conversations into signed letters of intent.
- Read the slide in ten seconds and say the number out loud. If a stranger can’t repeat it back, redesign it.
Then hand your deck to someone who’s never heard your pitch and give them fifteen seconds on the traction slide. What they remember is what an investor will remember. Make sure it’s the slope.