
 By
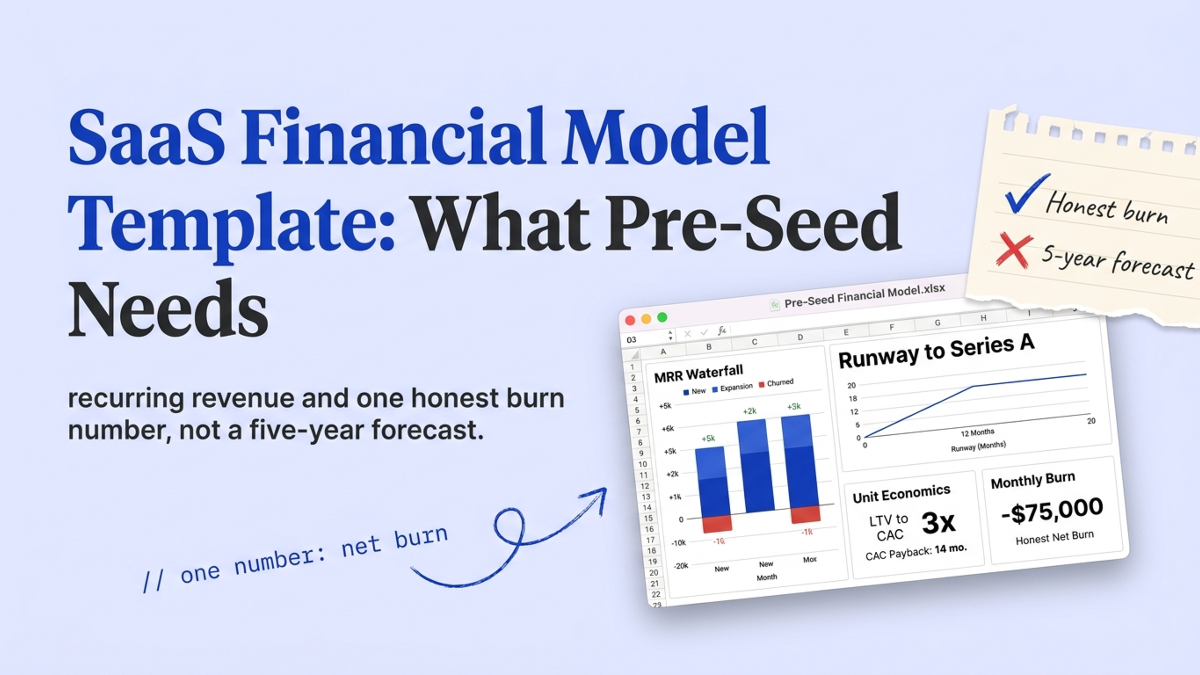
A SaaS financial model template is the spreadsheet that turns recurring revenue into a fundraising story: monthly recurring revenue (MRR), the customers who churn, and the cash you have left. Most templates you download are built for a scaling company, with cohort analysis and five-year forecasts. At pre-seed, that’s the wrong document. We review the models and decks founders send before they raise, and the SaaS ones that work are lean: an MRR build, a short list of unit economics, and one net-burn number the founder can defend. The 3:1 rule everyone quotes came later.
What does a SaaS model template need that a generic one doesn’t?
A SaaS model template adds three things a generic startup template leaves out:
- A recurring-revenue build, so a customer you win keeps paying month after month instead of once.
- A block of unit economics, so acquisition cost and lifetime value sit where a reviewer can find them.
- A retention view, so churn and expansion don’t hide inside a single revenue line.
Start from a normal pre-seed financial model, which is one assumptions tab, an expense list, a hiring plan, and a cash section. The SaaS version keeps all of that and layers recurring revenue on top of it.
Recurring revenue behaves differently from a one-time sale. A customer you win this month keeps paying, might upgrade, might leave. Your revenue tab has to track that movement, not just count sales.
Pricing adds a wrinkle. Chargebee reports that 51% of recurring-revenue companies now blend subscription with usage-based pricing (Chargebee, 2026), so if you charge a base fee plus usage, your revenue tab needs a row for each stream. The SaaS models we flag as weak treat revenue like a one-time sale, then wonder why the growth line looks nothing like their actual MRR.
The retention view is the third layer, and it’s the one founders skip. Track gross revenue retention, the share of recurring revenue you keep before any upsells, separately from net revenue retention, which adds expansion back on top. At pre-seed you won’t have real numbers for either yet. You’ll have an assumption, so label it as one and move on.
How do you build the MRR revenue waterfall?
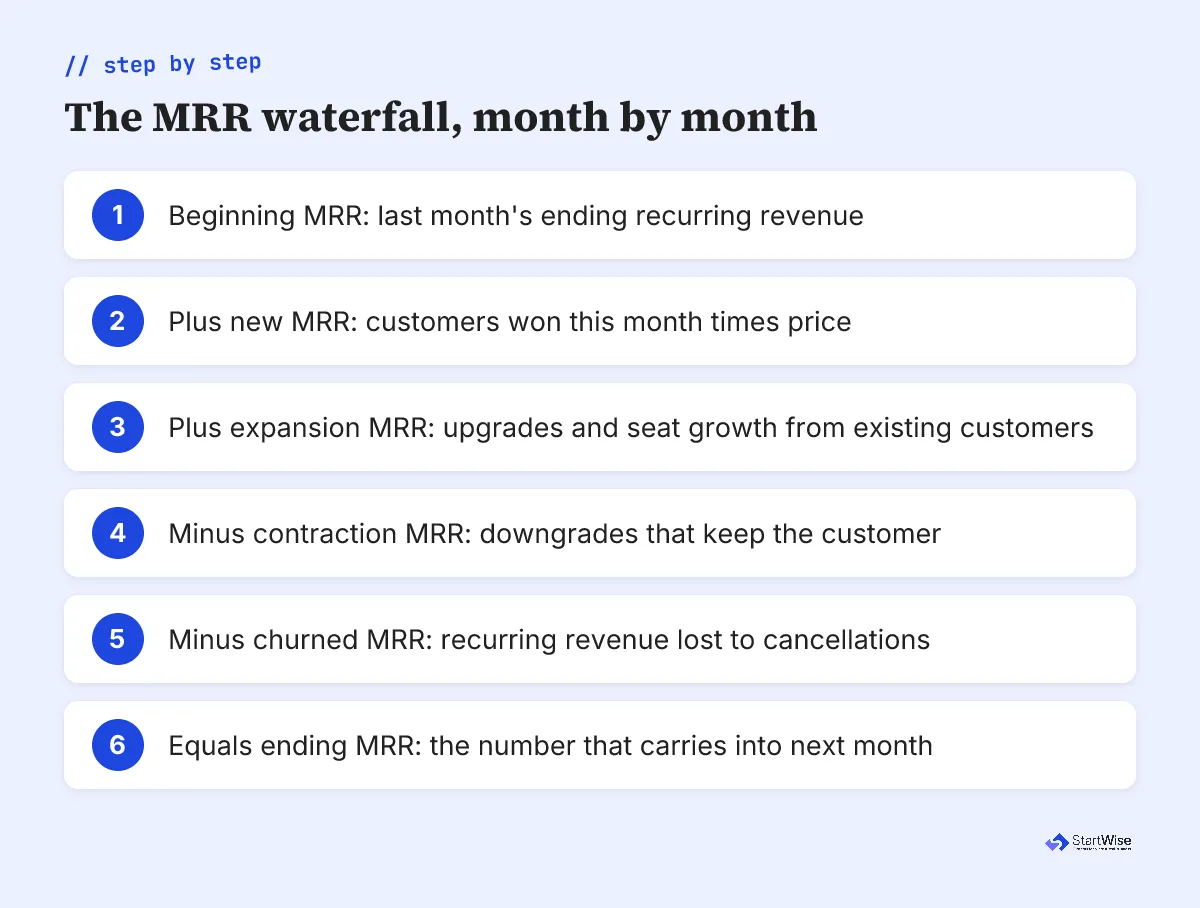
The MRR waterfall builds recurring revenue forward one month at a time, and every credible SaaS model runs on it. The identity is short: beginning MRR, plus new MRR, plus expansion MRR, minus contraction MRR, minus churned MRR, equals ending MRR. You carry the ending number into the next month and repeat.
Build new MRR bottom-up from real channels, not as a slice of some giant market. Top-down market math reads as a guess, and we walk through why investors distrust it in top-down vs bottom-up forecasting. Start with how many customers each channel actually brings you in a month, times price. That’s it.
Then keep churn honest. Under 1% monthly logo churn is exceptional and 1 to 2% is strong for early B2B SaaS (Beancount, 2026). The same source warns against annualizing by multiplying by 12, since 2% monthly compounds to about 21.5% a year, not 24%. In the models we review, the churn cell is where founders quietly cheat. A 0.5% monthly churn on a product three months old is a number nobody can back up, and a reviewer knows it.
The four SaaS metrics investors actually check
Investors check four SaaS metrics on your model, and each carries a 2026 benchmark worth knowing before you send it. Here’s the short version, with the numbers current sources report.
| Metric | What it measures | 2026 benchmark | Source |
|---|---|---|---|
| LTV to CAC | Lifetime value of a customer vs cost to win one | 3:1 to 5:1 healthy; median B2B 3.2:1 | Beancount, Foundry |
| CAC payback | Months to earn back acquisition cost | 12 to 18 months median B2B SaaS | Beancount |
| NRR | Revenue kept and expanded from existing customers | 105 to 115% median healthy | Beancount |
| Rule of 40 | Growth rate plus profit margin | 40 floor; 50-plus for premium valuations | Beancount |
Each metric maps to a part of the model. LTV to CAC comes straight from your acquisition cost and your expected retention, and CAC payback falls out of those same two inputs. Net revenue retention (NRR) reads your expansion and churn rows. The Rule of 40 needs a growth rate and a margin, which is why it belongs to later-stage companies.
CAC payback is the one worth building early, because you can estimate it before you’ve got a full cohort. Take what you spend to win a customer, divide by the gross margin they pay you each month, and you’ve got the months to break even. Say you spend $600 to land a customer paying $80 a month at 80% gross margin. That’s about $64 of margin a month. Payback lands near nine months, comfortably inside the 12-to-18-month median, and it’s a number you can defend from three real inputs.
Expansion is where SaaS models earn their optimism, and it’s easy to overcook. A model that assumes every account grows 3% a month has quietly bolted a second growth engine onto new sales. We ask founders to justify expansion the way we ask them to justify new customers: from a real motion like seat growth or a usage tier, never a smooth percentage that happens to make the year-two number look good.
We keep seeing founders paste these four numbers onto a slide as if hitting them proves the business. At your stage they prove something smaller and more useful: that you know which levers move the model.
A benchmark you can’t yet measure isn’t a target. It’s a promise about the model you’ll build once you have customers.
Do pre-seed SaaS founders need these benchmarks yet?
Pre-seed SaaS founders don’t need to hit these benchmarks yet, because the benchmarks were built for companies with years of cohort data. Foundry traces the 3:1 LTV to CAC rule to David Skok of Matrix Partners around 2010, applied to mature public SaaS at steady state, and says plainly it was never intended for pre-product-market-fit or seed-stage companies (Foundry, 2026).
NRR and the Rule of 40 need something you don’t have at pre-seed: a base of customers old enough to renew, expand, or leave. Modeling a 110% NRR before anyone has reached their first renewal is a forecast dressed as a fact, and an experienced reviewer discounts it on sight. It’s the same reason SaaS angels read your net-new MRR slope instead of a retention ratio this early.
So here’s our position after reviewing pre-seed SaaS models most weeks. Leave LTV to CAC off the model as a headline number, and show the inputs instead: price, expected retention, a rough acquisition cost. Let a reviewer compute the ratio and see your assumptions in the open. Claiming a 5:1 ratio on 40 customers reads as theater, not proof.
Built the SaaS model? See whether its numbers land where investors actually look.
How does the SaaS model connect to your pitch deck?
The SaaS model connects to your deck through one output: the net-burn number and the runway it buys, which lands on the financials slide. Everything upstream exists to make that number defensible.
That slide gets a skim, not a study. Investors spend about 3.2 minutes on a full deck and roughly 15 seconds on each slide after the cover, based on 3,000 decks and 8 million data points (Papermark, 2024). So the model has to resolve to something a reader holds in one glance. Cash on hand divided by net burn is your runway, and we cover the math in how to calculate cash runway; what actually belongs on the financials slide is a shorter list than most founders expect.
There’s one more reason the number matters: the model and the deck have to agree. When the runway on your financials slide doesn’t match the ask on your funding slide, a reviewer notices, and now they’re auditing you instead of listening to you.
StartWise's position
An ask slide fails by being shy. "18 months of runway to reach $50K MRR" is an ask a model can defend; "$500K to accelerate growth" is wallpaper. The model exists to turn your raise into a milestone that de-risks the next round.
The strongest SaaS models we see don’t end at a chart at all; they end at a single sentence a founder can say out loud. This much cash buys this many months to reach this MRR. If your model can’t produce that sentence, it isn’t finished, however many tabs it has.
What to build this week
Open a blank sheet and build the SaaS model in this order, top to bottom. Each step feeds the next, so you’ll want to resist the urge to start with a pretty chart.
- Assumptions tab: price per plan, monthly new customers per channel, conversion, salaries, and opening cash, all in one place.
- MRR waterfall: beginning plus new plus expansion minus contraction minus churned, month by month, for 18 to 24 months.
- Unit-economics block: acquisition cost per channel and gross margin, with LTV to CAC left as a live formula, not a headline you type in.
- Operating expenses and a hiring plan tied to the milestones this raise is meant to fund.
- Cash section: opening cash minus net burn each month, and the month the line hits zero.
- One output cell in plain sight: monthly net burn and the runway it buys.
That’s the whole template, and it’s the version we wish more founders sent us. It’ll fit in an afternoon, and it says more to an investor than any five-year forecast because every number traces to an assumption they can flex.
Then send the deck it feeds to someone who’ll be honest with you, before you send it to someone who writes checks.