
 By
By 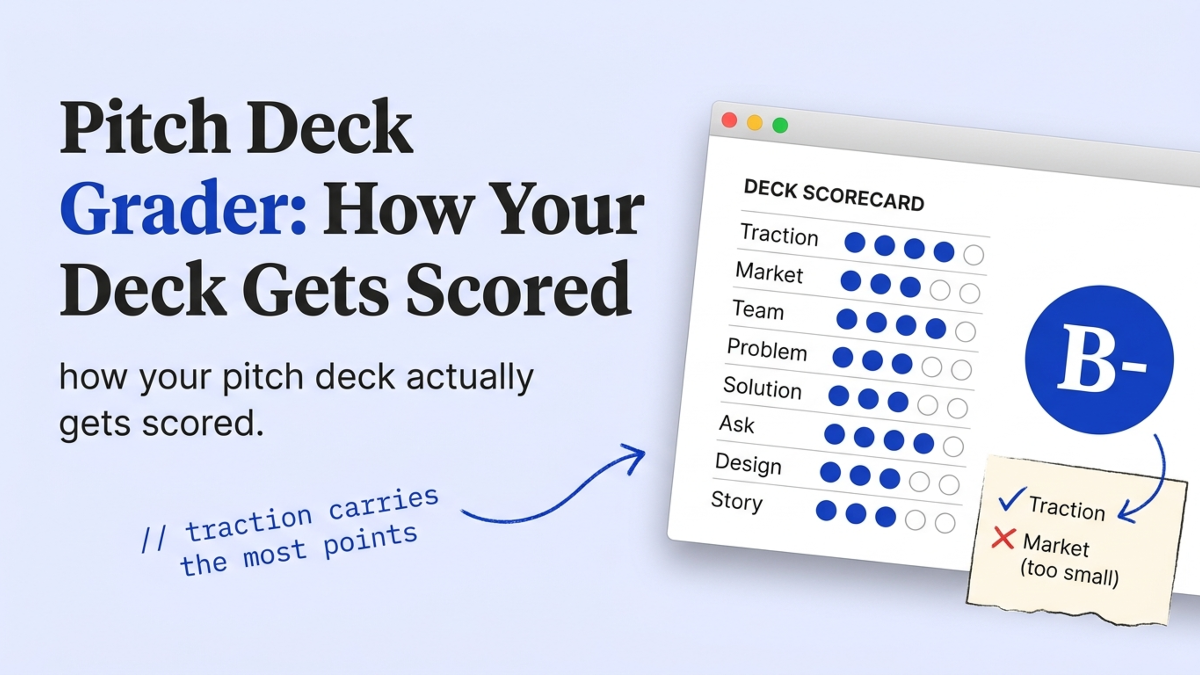
A pitch deck grader is a tool that scores your deck against a fixed rubric and hands back a number or a letter grade. The good ones don’t score every slide the same. They weight the slides investors actually read, then check whether yours reads in the few minutes you get. We review decks every week, and the founders who get the most from a grade are the ones who understand the rubric underneath it. Here is that rubric, the bands your score lands in, and how to grade your own deck first.
What does a pitch deck grader actually score?
A pitch deck grader scores two different things, and most founders only hear about one. The first is your business: traction, market, team, the raw fundability of what you’ve built. The second is the deck itself. Can a stranger follow your story while skimming it cold? SaaStr’s AI analyzer, after grading more than 4,000 VC decks, splits these into a Traction Score and a Deck Quality Score before it ever shows you a grade.
That split matters because you can fix one a lot faster than the other.
A grader is sharp on the deck half and weak on the business half. It sees a missing market slide instantly. It can’t tell you whether your market is real. If you want the full version of what a machine catches and what it misses, we wrote a separate guide to AI deck review. Here, the question is narrower: how does the score get built, and what moves it?
How is a pitch deck graded? The weighted rubric investors use
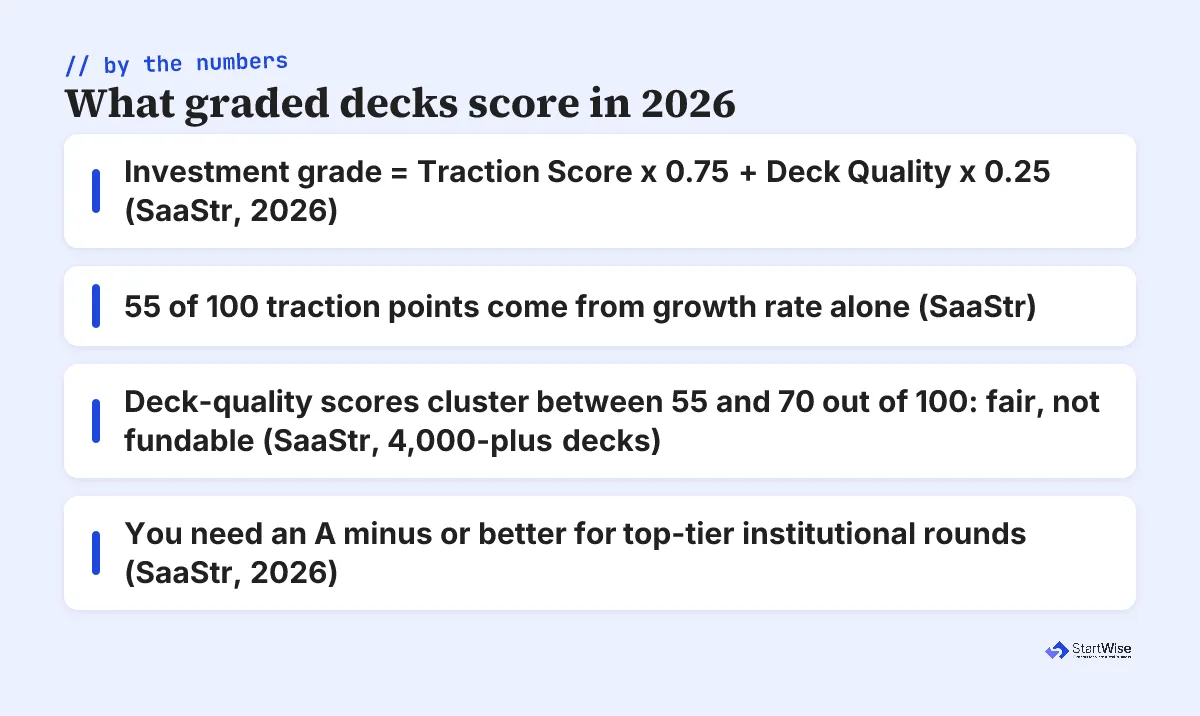
A deck is graded on a weighted rubric where traction outweighs everything and design barely registers. This is the part the tools hide. PitchBob’s published scorecard lists 12 dimensions on a one-to-five scale and treats them all equally, for a flat maximum of 60 points. PitchBob generates decks too, and if its output left you cold, we compared the main alternatives. Fundable Startups flags a related gap: most scorecards grade only about six criteria even though a deck runs a dozen slides, so half of it goes unscored. Real investors don’t grade flat. SaaStr’s model pulls 55 of its 100 traction points from growth rate alone, then weights the final grade as Traction Score times 0.75 plus Deck Quality times 0.25.
Read that formula again. Three quarters of your grade is whether the business is moving.
Here is the rubric we use in the review room, ordered by how much each dimension moves the grade:
| Dimension | What a high score looks like | Weight |
|---|---|---|
| Traction | A growth slope with a believable mechanism, not a vanity total | Highest |
| Problem | A specific, painful problem the reader feels before the solution | High |
| Market | A bottom-up count of reachable year-one customers | High |
| Team | Relevant scars: shipped it, sold it, lived the problem | High |
| Solution | A direct fit to the problem, shown with a demo or screenshot | Medium |
| Business model | A clear path from a user to a dollar | Medium |
| Ask | One milestone the raise funds, sized with runway math | Medium |
| Design and clarity | Slide titles that carry the story on a skim | Lowest |
Notice where design sits. Founders pour days into fonts and lose points on the ask slide instead, which a grader weights several times higher. My honest take after reviewing decks every week: most low grades are a content problem wearing a design costume.
What grade does the average pitch deck get?
The average deck gets a passing grade and a polite no. SaaStr found deck-quality scores cluster between 55 and 70 out of 100, a band it bluntly calls “fair. Not terrible. Not fundable.” Most founders aren’t shipping bad decks. They’re shipping forgettable ones, and forgettable scores a C.
Here is how to read the band your grade falls into:
- A range (90 and up): fundable on the deck alone, and rare. SaaStr says you need an A minus or better to be in the game for top-tier institutional rounds.
- B range (70 to 89): a real conversation. The story is legible and the gaps are fixable before the meeting.
- C range (55 to 70): where most decks sit. Competent, unmemorable, easy to pass on.
- Below 55: a rewrite, not a redesign.
Most decks aren’t bad. They’re forgettable, and forgettable scores a C.
55 to 70
The out-of-100 band where most deck-quality scores cluster, which SaaStr calls "fair, not fundable" after grading more than 4,000 decks (SaaStr, 2026)
The good news in that number, and the reason we stay optimistic in the review room: the median is low, so a deck that’s genuinely clear stands out fast. You’re not fighting for an A against a field of A decks. You’re trying to escape the muddy middle.
How to grade your own deck in three minutes
You can grade your own deck in roughly the time an investor will, and you should do it before any tool does. Papermark clocked the average deck review at 3.2 minutes across 3,000 decks in 2024, with 23 seconds on the first slide and around 15 on each one after. That’s your grading window. If your deck doesn’t earn its grade inside it, the score a real investor gives will be the one that counts.
Run this scorecard:
- Score eight dimensions from one to five using the rubric above. Be honest; you’re not the audience.
- Double the traction score before you add anything up. It carries the most weight, so it should swing your total.
- Convert the total to a percentage of the maximum. That’s your raw grade.
- Now read only your slide titles, in order, and nothing else. Do they tell the whole story? If a stranger couldn’t follow the plot from titles alone, dock a full letter grade. Investors skim titles first, which is also why slide count and title quality move together.
- Time the whole read at 3.2 minutes. If you can’t finish, neither can they.
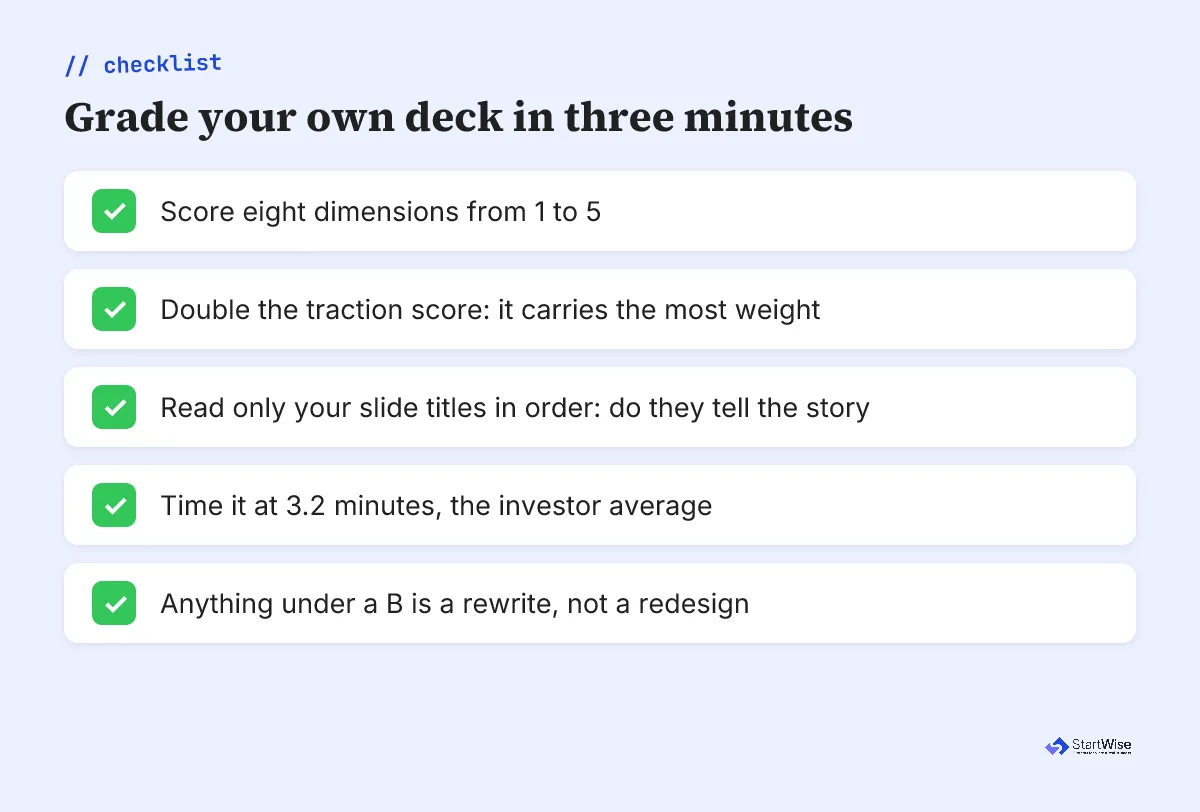
The rule we give every founder: anything under a B is a rewrite, not a redesign. A C deck doesn’t need nicer charts. It needs a sharper problem and a traction slope that reads in seconds. Fix the content the rubric weights, then make it pretty.
Graded your own deck? Get the slide-by-slide version free, with a concrete fix list in minutes.
How does grading change from pre-seed to seed?
Grading weights shift hard between pre-seed and seed, and a grader that ignores your stage will mislead you. At pre-seed, you’ve got almost no numbers, so the rubric leans on team and the believability of your traction slope. At seed, the same dimensions get graded against hard evidence. A “we grew 30% week over week for two months” that earns a strong pre-seed mark becomes a thin seed answer once investors expect revenue and retention.
| Dimension | Pre-seed grade weight | Seed grade weight |
|---|---|---|
| Traction | Direction and a believable mechanism | Hard numbers: revenue, retention, growth rate |
| Team | Heaviest input: can this team win | Still high, but traction starts to outweigh it |
| Market | Bottom-up logic plus a clear wedge | Same logic plus early proof the wedge works |
| Financials | A simple 12 to 24 month model | A model investors interrogate line by line |
That’s the gap in every generic grader. SaaStr’s own write-up notes that founders raising a Series A in 2026 are competing against AI-native companies growing 300 to 500% at similar revenue. Grade a pre-seed deck against that bar and you’ll gut a deck that’s doing fine for its stage. Pick the rubric that matches where you actually are.
Why vague market sizing drags down your grade
Vague market sizing is one of the three weaknesses graders punish hardest, alongside thin competitive differentiation and buried team credibility. SaaStr names all three as the most common markdowns across its 4,000-plus graded decks. Market sizing is the one founders think they are nailing, because a giant TAM feels like ambition, but it isn’t. To a grader trained on what investors trust, it reads as a dodge. The fix is a bottom-up number: our TAM SAM SOM example walks through the math a reviewer trusts.
StartWise's position
Most market-size slides are theater. A bottoms-up count of reachable customers in year one tells an investor more than any trillion-dollar TAM, and it's what the rubric rewards. If your "1% of a huge market" math cannot survive a napkin check, it's costing you points, not earning them. Count the customers you can actually reach, name the wedge, and let the big number sit in the appendix.
A top-down number nobody can verify scores low because it cannot be graded true. A bottom-up number can. Show the customer count, the price, and the path, and you turn a soft dimension into a hard one. The same logic runs through the strongest pitch deck examples we study: their market slides count something real.
Which pitch deck grader should you use?
The grader you pick matters less than whether its rubric weights traction over design. Search “pitch deck grader” in 2026 and you hit a wall of free AI tools, and they disagree on how a deck should be scored. SaaStr’s analyzer, the tool behind the 4,000-deck dataset, blends traction and quality at that 0.75 to 0.25 ratio, weighting the business you built far above the slides you designed. Score My Deck grades seven dimensions and weights them unevenly. SeedAngels checks 34 criteria across eight themes and marks each one covered, partial, or missing. Same search, three different rubrics.
That spread is the thing to watch.
A grader that treats 34 criteria as equal weight scores your logo placement the same as your growth rate, and no investor reads a deck that way. The flat checklist tools hand you a tidy percentage that feels precise and means little.
My honest take after reading these outputs next to real decks: use whichever tool is fastest and free, then read only the weighted verdict. Ignore the flat percentage a checklist grader hands you and look at what it says about your traction and problem slides. That’s the three quarters of the grade that decides whether you earn the meeting. A grader that can’t tell you which dimension to fix first is a spell-checker with a dashboard.
Should you trust an automated pitch deck grade?
Trust an automated grade for what it measures and ignore it for what it guesses. A grader is consistent in a way no human reviewer is. It applies the same rubric to slide one and slide twelve, never gets bored, and never goes easy on a founder it likes. That consistency is exactly why the mechanical score is worth having.
A grader scores whether your deck is legible. It can’t score whether you’re right.
Where I wouldn’t trust it: the verdict on whether you’re fundable. That’s the call worth paying a human for, and we compare what each pitch deck review service charges for it.
A grader can flag that your market slide is vague. It can’t know that the market is about to crack open because of a regulation shipping next quarter. It scores legibility, and legibility is most of what loses early meetings, so the grade is a strong readiness signal. Read it as “is my deck clear,” not “will this get funded.” For the judgment calls a machine can’t make, our breakdown of AI versus human review maps exactly where each one earns its keep.
What to do this week
Grade your deck before an investor does. Run the eight-dimension scorecard, double the traction line, then read your titles cold against the 3.2-minute clock. If you land in the 55-to-70 band where most decks sit, you’ve found your problem, and it’s almost never the design. Rewrite the lowest-weighted dimension that’s dragging you down, recount your market from the bottom up, and grade it again. Two passes is usually enough. In our reviews, that second pass is what moves a deck out of the muddy middle and into a real conversation worth having.