 By

Unit economics are the profit and loss of a single customer: what one costs you to acquire, and what one returns before they leave. At pre-seed, that’s usually two numbers you can barely measure yet. We review the decks founders send before they raise, and this is where the honest ones separate from the dressed-up ones. The 2025 median SaaS company needed 16 months to earn back its acquisition cost (Aleph and Benchmarkit). So most “clean” ratios on early decks are guesses wearing a suit.
What are unit economics for a startup?
Unit economics are the costs and returns tied to one unit of your business, almost always one customer. Three numbers carry the whole story, and you can define each in a sentence.
- CAC, customer acquisition cost: everything you spent on sales and marketing in a period, divided by the customers you won.
- LTV, lifetime value: the gross margin one customer returns before they churn, not their revenue.
- Payback period: how many months of that customer’s margin it takes to earn the CAC back.
Two ratios sit on top. LTV:CAC tells you whether a customer is worth more than they cost. Payback tells you how fast the cash comes home. The rule of thumb David Skok popularized at forEntrepreneurs is an LTV:CAC above 3 and CAC recovered in under a year. Hold that number loosely for now.
Here’s the catch most pre-seed founders miss. LTV depends on churn, and churn needs months of cohort data you don’t have yet. So the metric that looks most impressive is the one you can least defend. When we review early decks, we start where you can: CAC, the number you can actually count.
Why is a clean LTV:CAC ratio fiction at pre-seed?
A clean LTV:CAC ratio is fiction at pre-seed because LTV is built on a churn rate you’re guessing. If you’ve got three months of data, you can’t know how long a customer stays, so any lifetime number is an assumption dressed as a fact. Skok himself notes that many healthy businesses miss the guidelines in their early days and improve toward them over time.
We see the same move constantly in the review room. A founder computes LTV from a 2% monthly churn they picked because it sounded reasonable, multiplies it out, and lands on a tidy 4:1. An investor who reads these for a living spots it in seconds. The number is too clean for a company with 40 customers.
A 4:1 ratio on three months of data is not a metric. It is a hope with a decimal point.
The harm isn’t that the number is wrong. Everyone knows early numbers are wrong. The harm is what a polished fiction signals: either you don’t understand the formula, or you think the investor doesn’t. Neither earns the meeting. Show a smaller, truer number and you get credit for knowing the difference.
What do investors actually want to see at pre-seed?
Investors at pre-seed want evidence you understand your economics and a reason to believe they improve, not a passing grade today. A ratio is a snapshot. What they’re buying is the slope. Mercury’s team puts it plainly: at the early stage, a 1-2x LTV:CAC is acceptable as long as there is a clear path to improving it, tightening to 3:1 and beyond by Series A.
So lead with direction. A founder whose CAC dropped from $400 to $220 over two quarters, with a named reason, is telling a better story than one asserting a static 5:1. The first founder understands the lever. The second has a spreadsheet. We’d back the first one every time.
StartWise's position
Unit economics at pre-seed are a slope, not a number. Investors read the direction and the mechanism behind it: week-over-week or cohort-over-cohort movement with a believable cause beats any single ratio. Show the trend line and the lever that bends it, and the absolute value matters far less.
This is the same thing a strong traction slide does, applied to cost and value instead of users. Pair one real CAC with one leading retention signal and the mechanism connecting them. That reads as a founder who will figure the rest out, which is the actual bet at this stage.
How do you calculate CAC and LTV honestly?
You calculate CAC and LTV honestly by using real spend and real retention, then labeling every assumption you had to make. The math is simple. The discipline is in refusing to flatter it.
- CAC: total sales and marketing spend, salaries and tools included, divided by new customers in the period. The ad-spend-only version is the vanity one.
- LTV: gross margin per customer divided by churn rate. Use margin, not revenue, or you overstate it by your whole cost of delivery.
- Payback: CAC divided by monthly gross margin per customer. It’s the number you can defend earliest, so lead with it.
The most common tell we flag is a CAC that counts only ad spend. A founder reports $50 CAC, then admits two people spend half their week on sales. Loaded properly, that CAC is $300. Investors assume the loaded number exists whether you show it or not, so show it first. Segment by channel too: a blended CAC hides that one channel is cheap and tapped out while another is expensive and scalable.
When you can’t compute a trustworthy LTV, don’t fake one. Show a 30 or 60-day retention curve instead, a leading indicator of the lifetime you can’t measure yet. Match the depth of all this to what investors want by stage, and keep the full build in your financial model.
What is a good payback period, really?
A good payback period is shorter than the margin your runway can fund, and the honest benchmark is further out than most guides admit. The 2026 Aleph and Benchmarkit report, drawn from 342 B2B SaaS and AI companies, puts the 2025 median CAC payback at 16 months, down from 18 the year before, the largest single-year gain in four years of data. Top-quartile companies recover in 6 months or less. The bottom quartile takes 24 or more.
It varies by deal size. Companies under $5K average contract value hit an 11-month median, while enterprise deals at $50K to $100K stretch to 22. So the textbook “under 12 months” is really a top-quartile target, and we stopped expecting it on pre-seed decks a long time ago. Qubit Capital’s 2026 read lands in the same place: under 18 months is fine at seed, compressing toward 12 by Series A.
| Stage | LTV:CAC investors expect | Payback they accept | What they are really reading |
|---|---|---|---|
| Pre-seed | A credible estimate, slope improving | A defensible first-channel number | Do you understand your own lever |
| Seed | 1-2x, clearly improving | Under 18 months | Is the trend real and repeatable |
| Series A | 3:1 or better | Under 12 months | Does the machine already work |
16 months
The 2025 median CAC payback for B2B SaaS, not the textbook 12. Chasing a number below the funded median on a pre-seed deck reads as copied, not measured. Aleph and Benchmarkit, 342 companies, 2026
Not sure your unit economics hold up slide-by-slide? See what a reviewer would flag before an investor does, free and in minutes.
Where unit economics go in a pre-seed deck
Unit economics usually live inside your traction or financials slide at pre-seed, not on a dedicated slide of their own. A standalone unit-economics slide invites scrutiny you can’t yet survive, so most early decks fold two or three numbers into the story instead. Put your fully-loaded CAC and a retention signal where they support the narrative, and keep the working math in the financial model behind the deck.
If you do give it a slide, it belongs late, near the financials, and it earns its place only with real numbers. One founder we reviewed cut a whole unit-economics slide down to a single line on traction, and the deck got stronger. The slide had been padding a story the one honest number already told. When investors start asking questions, the unpadded version holds up and the padded one unravels.
What to do this week
You don’t need a finance background to fix this. You need an afternoon and a refusal to round in your own favor. The founders we see raise fastest are the ones whose one number survives a second question.
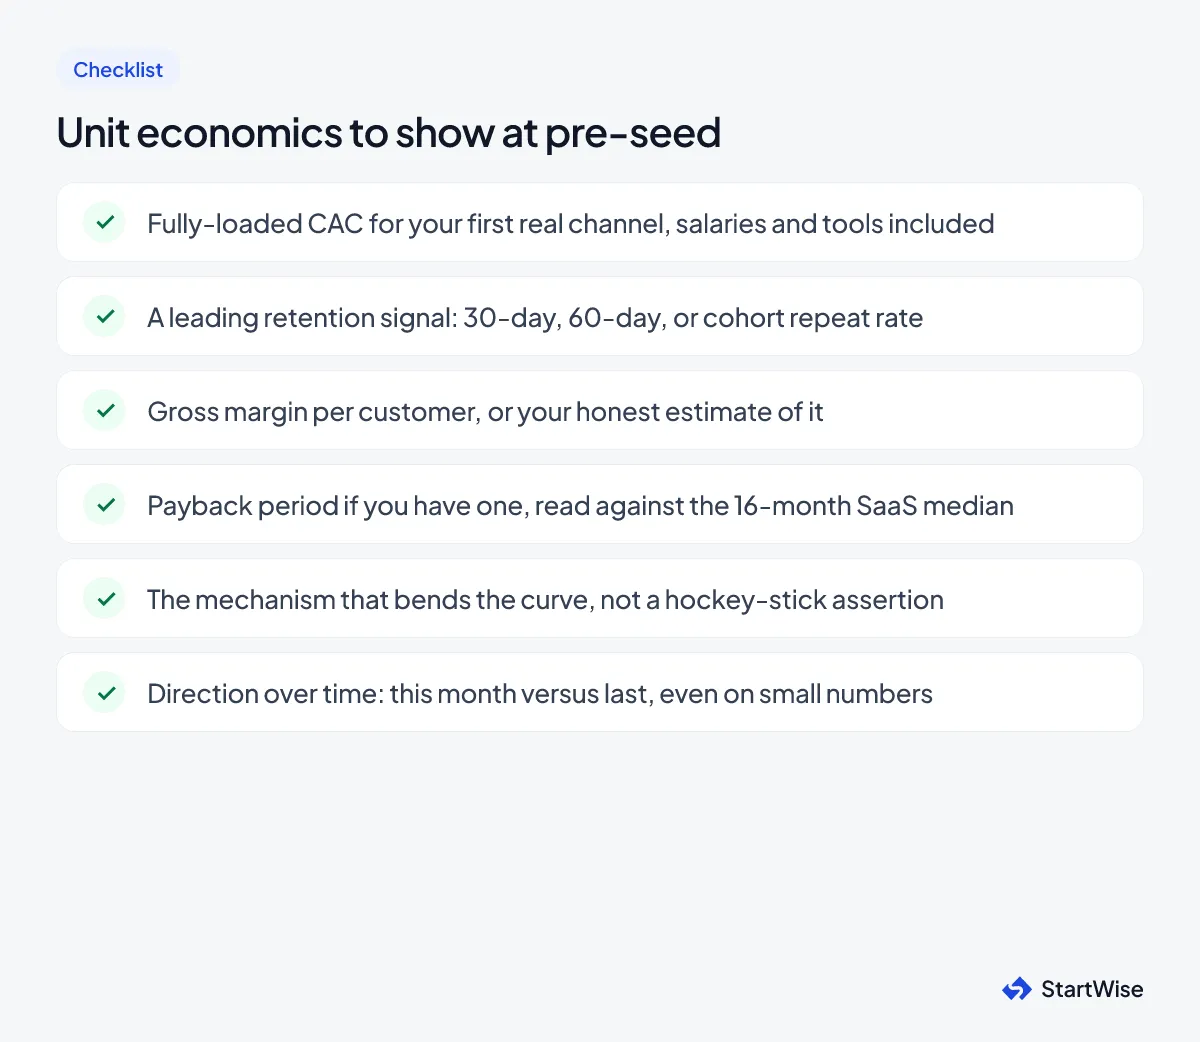
- Count your fully-loaded CAC for one channel: all spend plus the fraction of salaries that chase customers, divided by customers won.
- Replace any LTV built on guessed churn with a 30 or 60-day retention number you actually have.
- Write the one mechanism that improves the metric, in a sentence, and put it next to the number.
- Read it against the 16-month median and your own runway, then decide whether it earns a slide or a line.
Then say the number out loud and answer the obvious follow-up. If the second question breaks it, the metric wasn’t ready to show.
